
1. Binary Analysis on Linux
Exercise 1: Performing Binary Analysis on Linux
In this lab, we will perform binary analysis on a Linux system to understand how executables are structured and function. By using tools such as LinPEAS, Rabin2, GDB, and Readelf, we will analyze the properties of a binary file, extract relevant information, and identify potential vulnerabilities or insights about its behavior. This step-by-step process will help us build a deeper understanding of binary analysis techniques.
Lab Tasks
Login to the Software-Test-Linux-32bit machine using studentpassword as password.
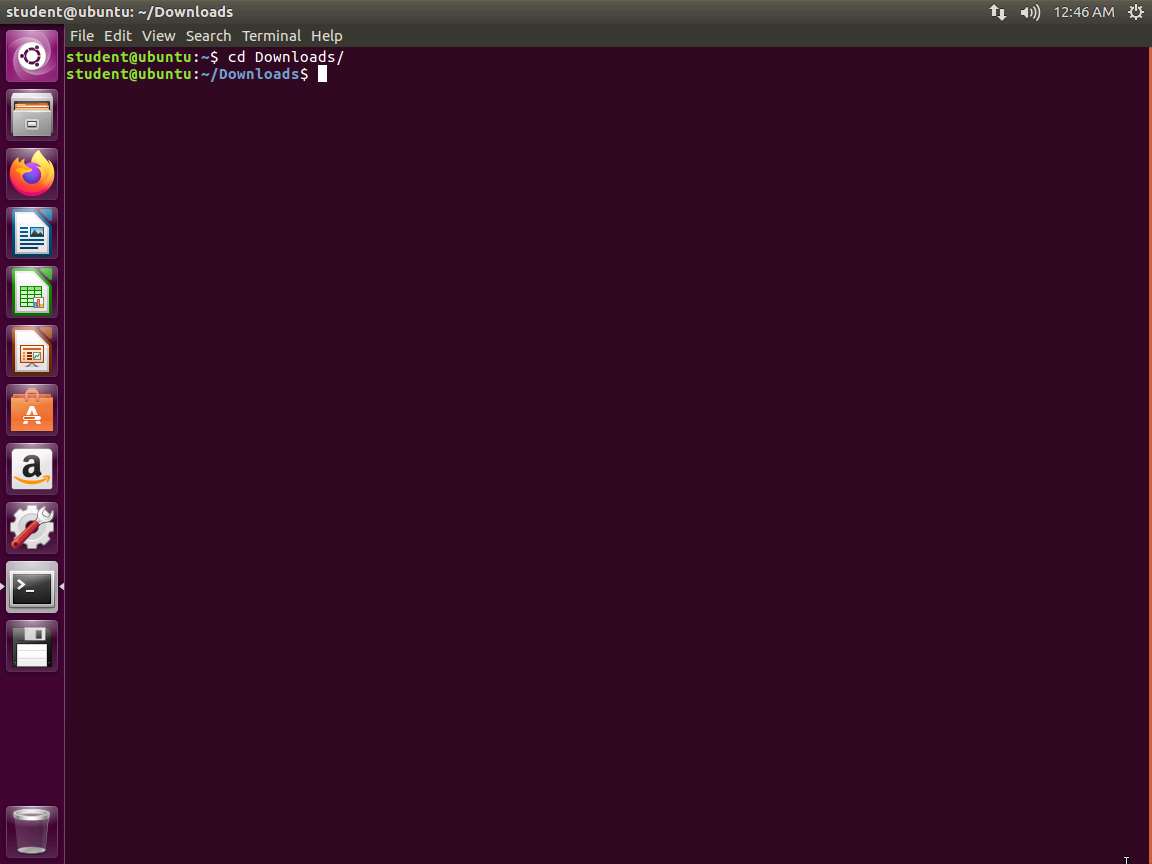
Screenshot Open a terminal window, and enter cd Downloads.
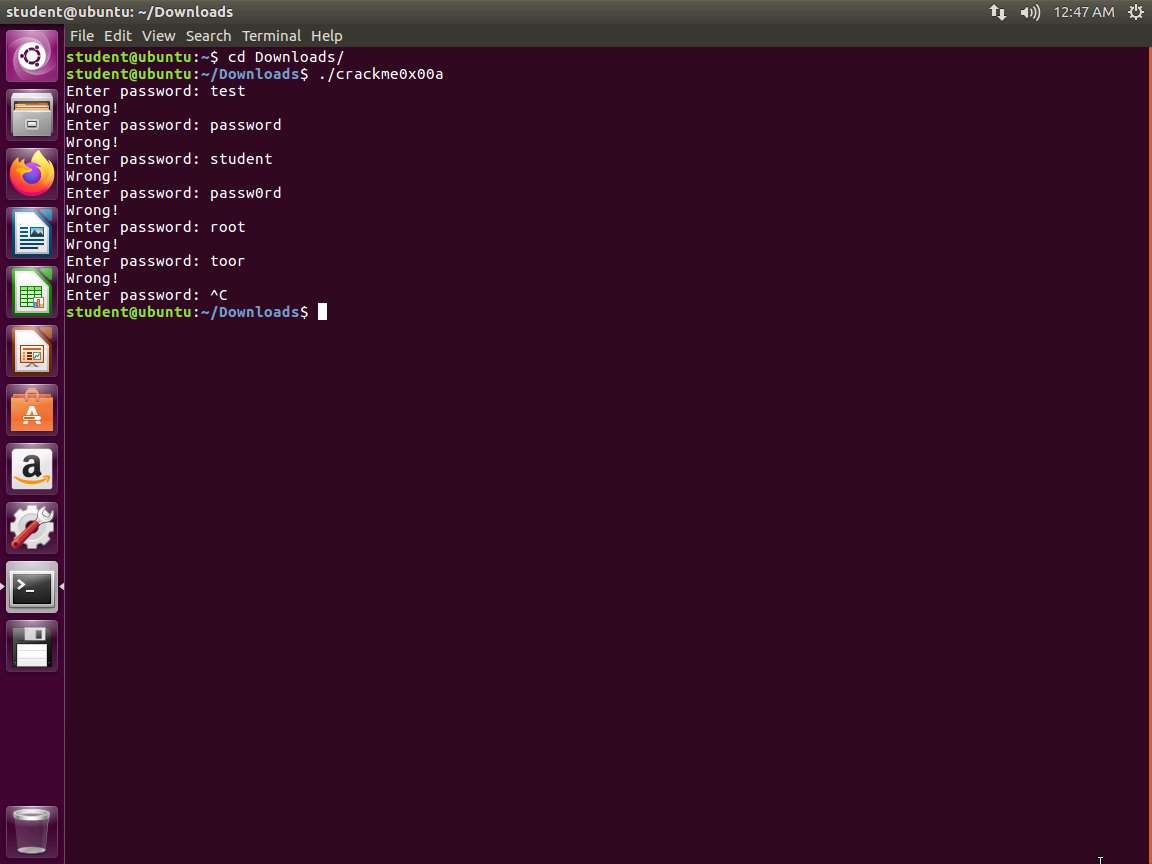
Screenshot Once you are in the folder, enter ./crackme0x00a. In the 64-bit machine, the program will not run since it is not built for 64 bit, so we will continue with the 32-bit machine for now. Once you run the program, enter some passwords to see if you can determine what the password is. An example of this is shown in the following screenshot.
Screenshot Since we could not guess it, we now need to perform an analysis and see what we can learn about the file. We will use the file command. Enter file crackme0x00a. The output of this command is shown in the following screenshot.
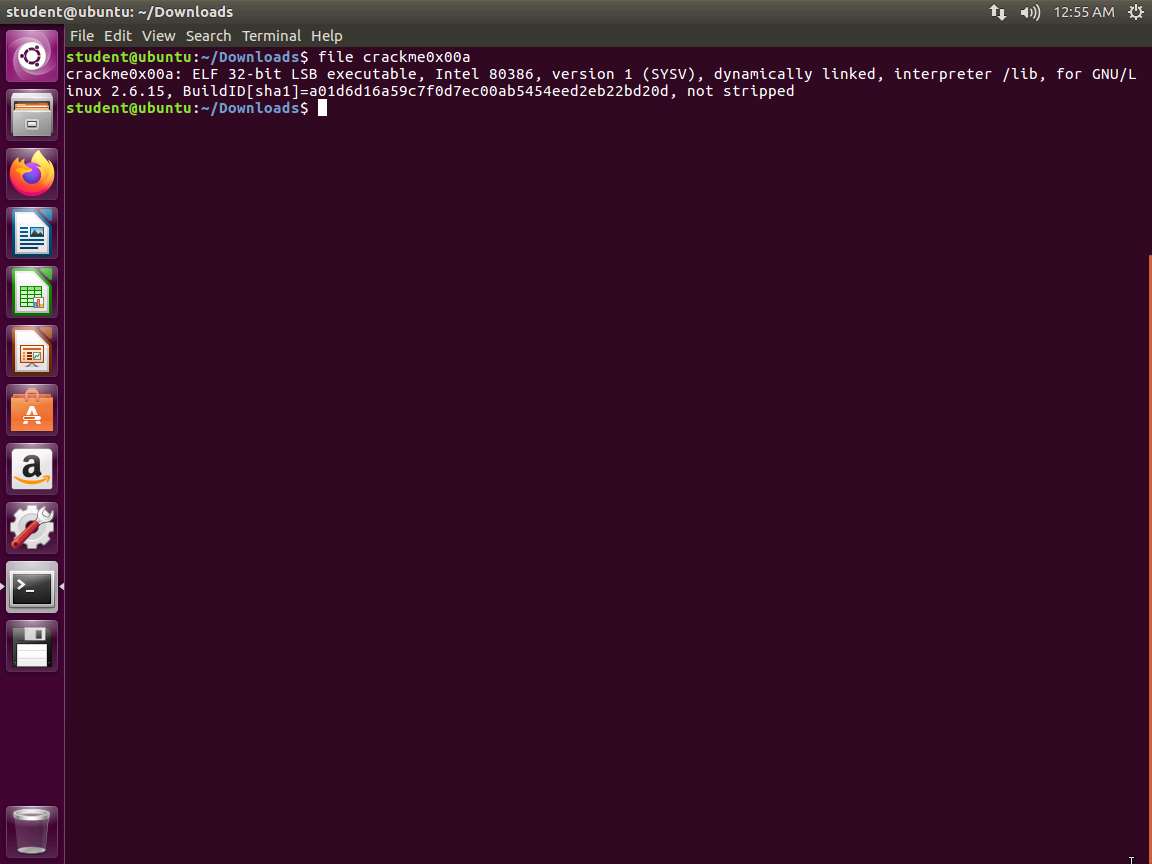
Screenshot As the above screenshot shows, we have an executable and linking format (ELF) 32 bit executable. The file is 32-bit, LSB executable (least-significant byte). It means that the file is little-endian.
We will use another tool. Enter rabin2 -I crackme0x00a. An example of the output of this command is shown in the following screenshot.
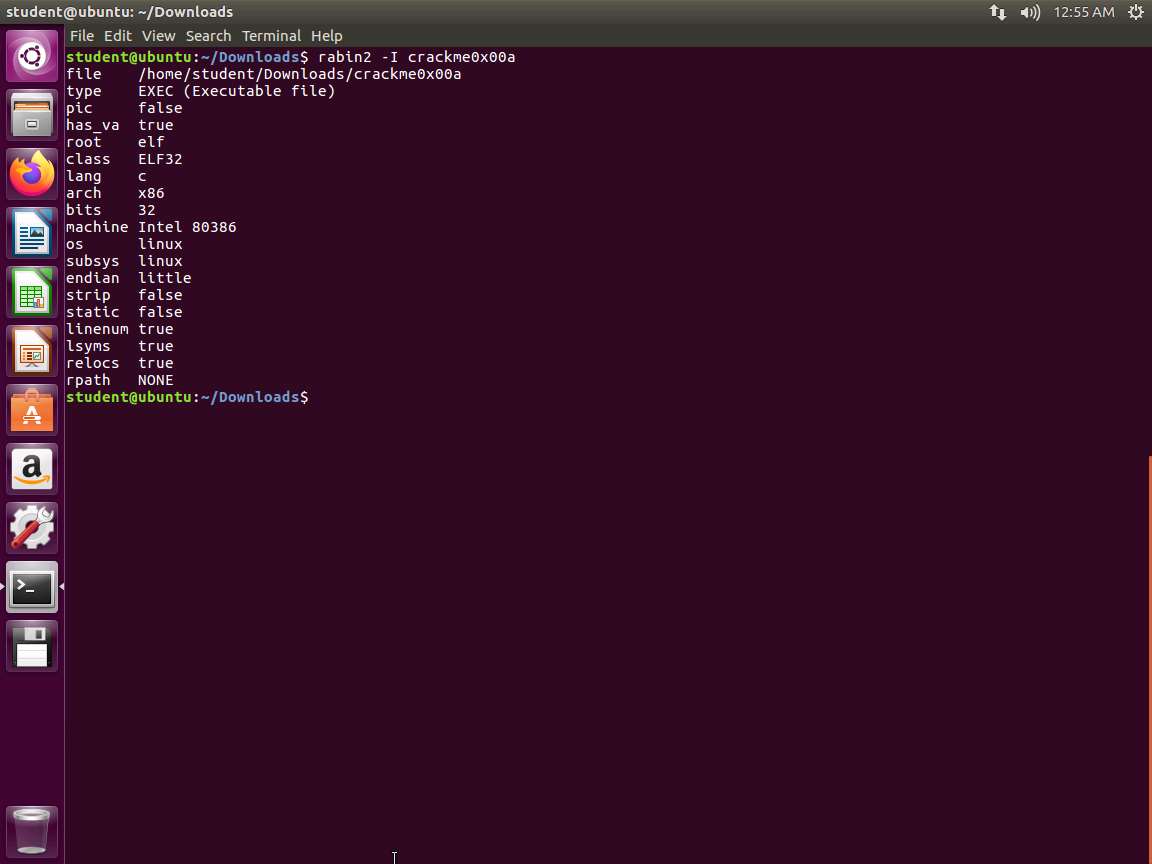
Screenshot Let us now use powerful tool strings to see what we can discover in the binary. Enter strings crackme0x00a. An example of the output of this command is shown in the following screenshot.
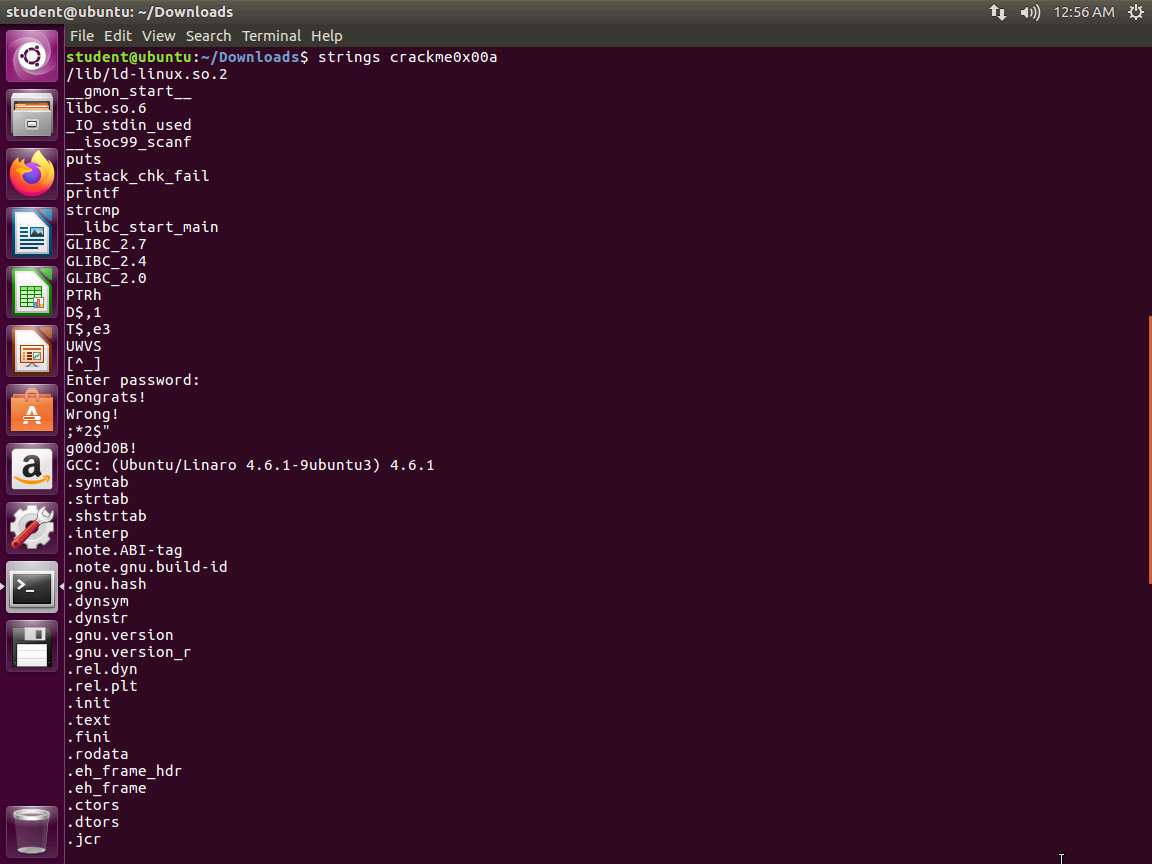
Screenshot As you review the strings, do you see anything of interest? We have the prompt for the password followed by what appears to be two responses and then a string. This could be the password, but it seems too easy. We will continue to explore the file further.
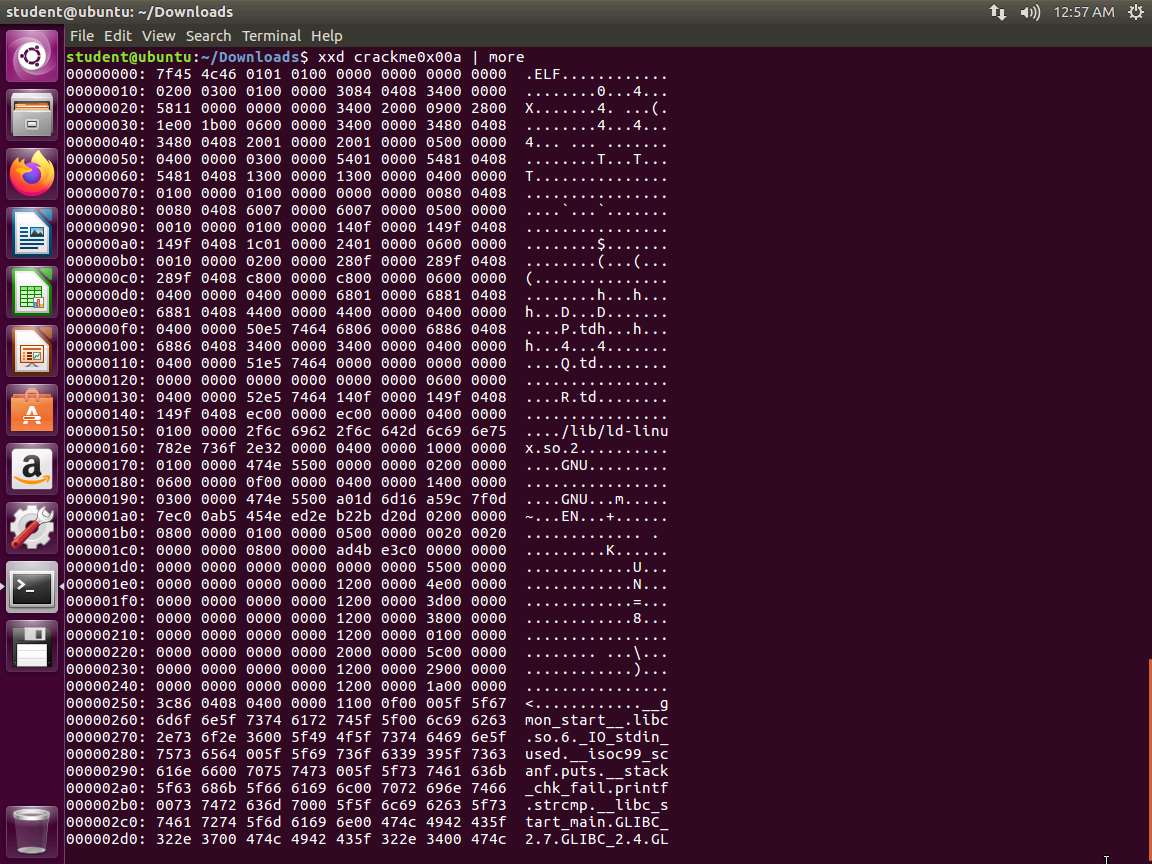
In the terminal window, enter xxd crackme0x00a | more. The output of this command is shown in the following screenshot.
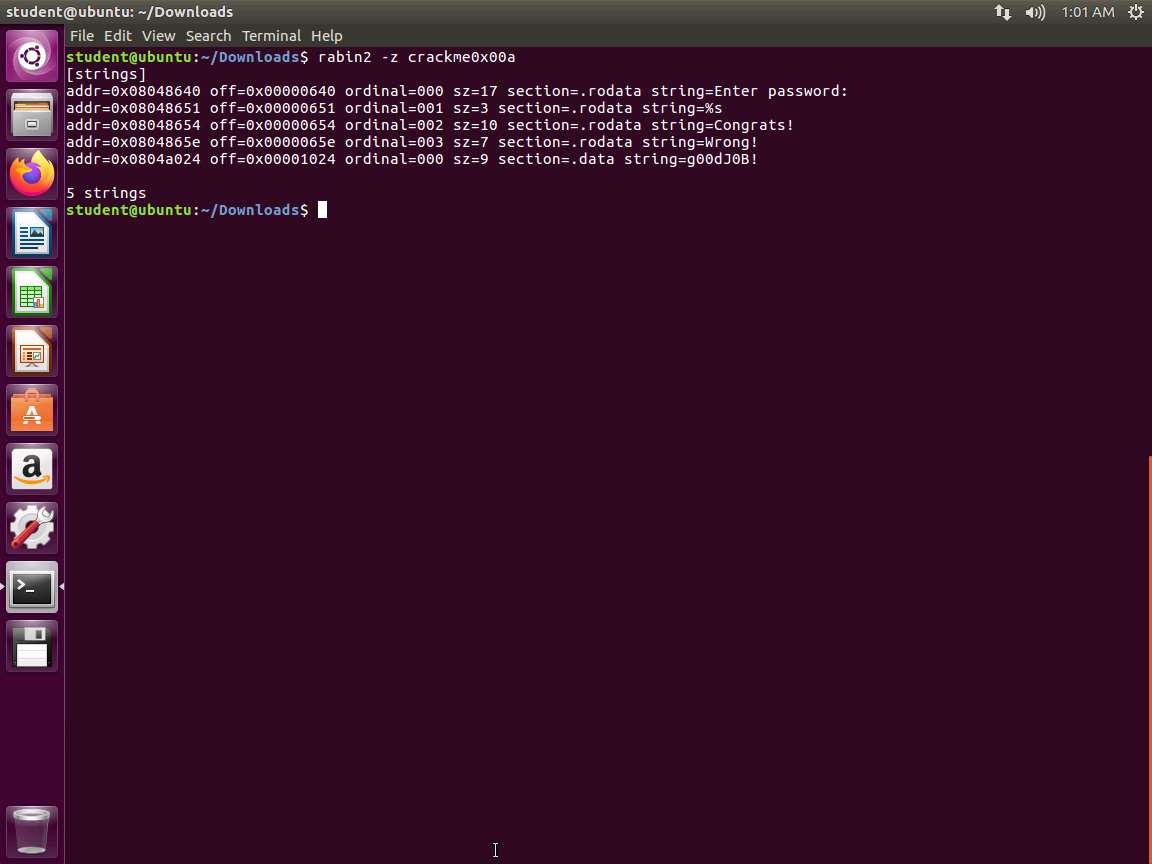
Screenshot To use rabin2 to crack the file, you will need to execute with a different parameter than the one we used at the information gathering process. If you refer to the manual, you will see that the parameter -z is used to show strings inside .data section (similar to gnu strings).
In the terminal window, enter rabin2 -z crackme0x00a. An example of this is shown in the following screenshot.
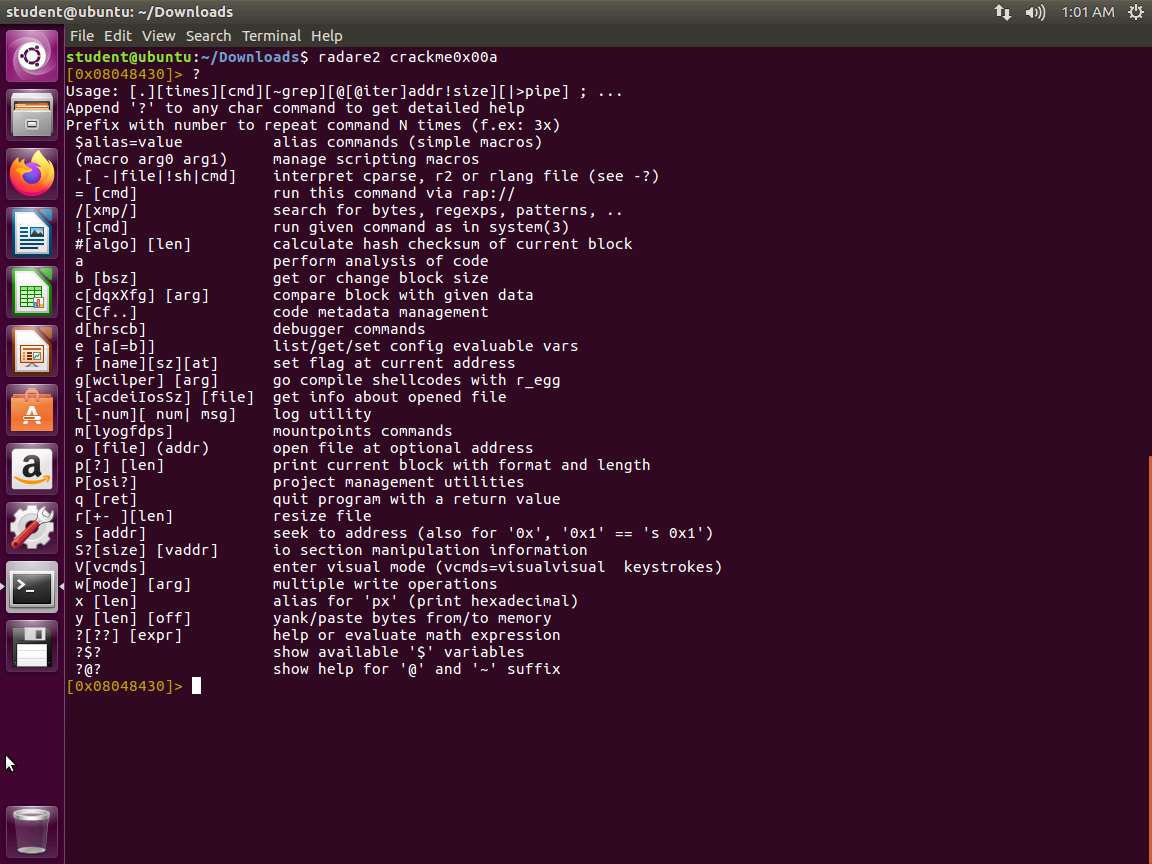
Screenshot Next, we will use the Radare2 tool to look at the executable. In the terminal window, enter radare2 crackme0x00a. Once the program is entered, enter ?. This will allow you to review the different options. An example of the output of this command is shown in the following screenshot.
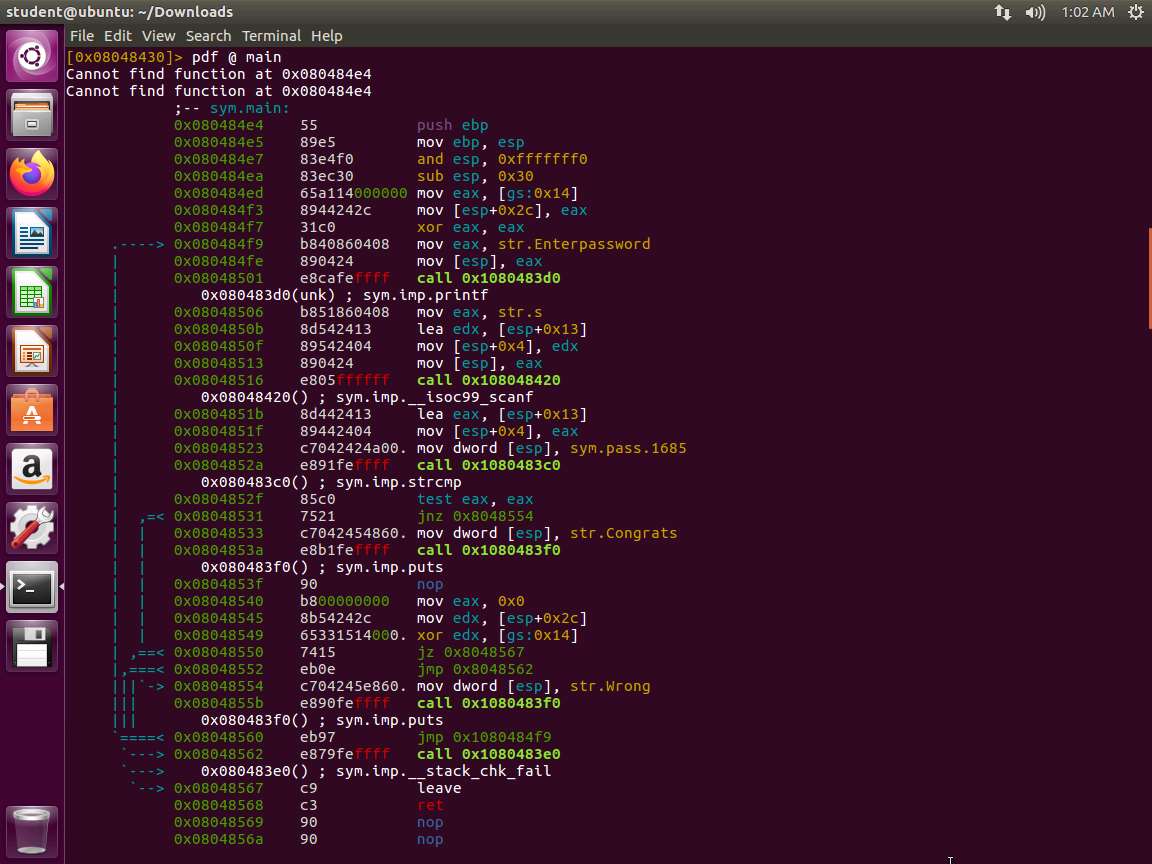
Screenshot We now want to run the disassemble function. Enter pdf @ main. The output of this command is shown in the following screenshot.
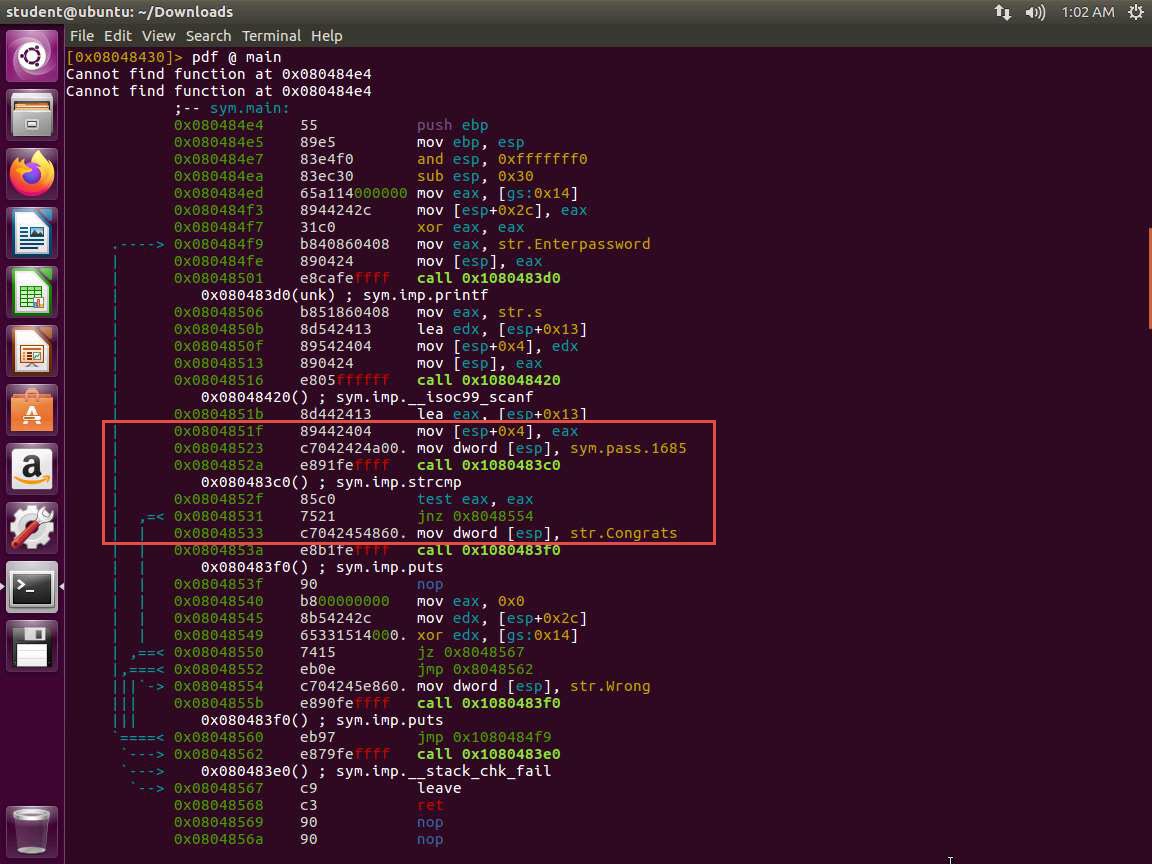
Screenshot Take a few minutes and look through the disassembled code. An example of this is strcmp, which is where our password is evaluated. Please check the following screenshot.
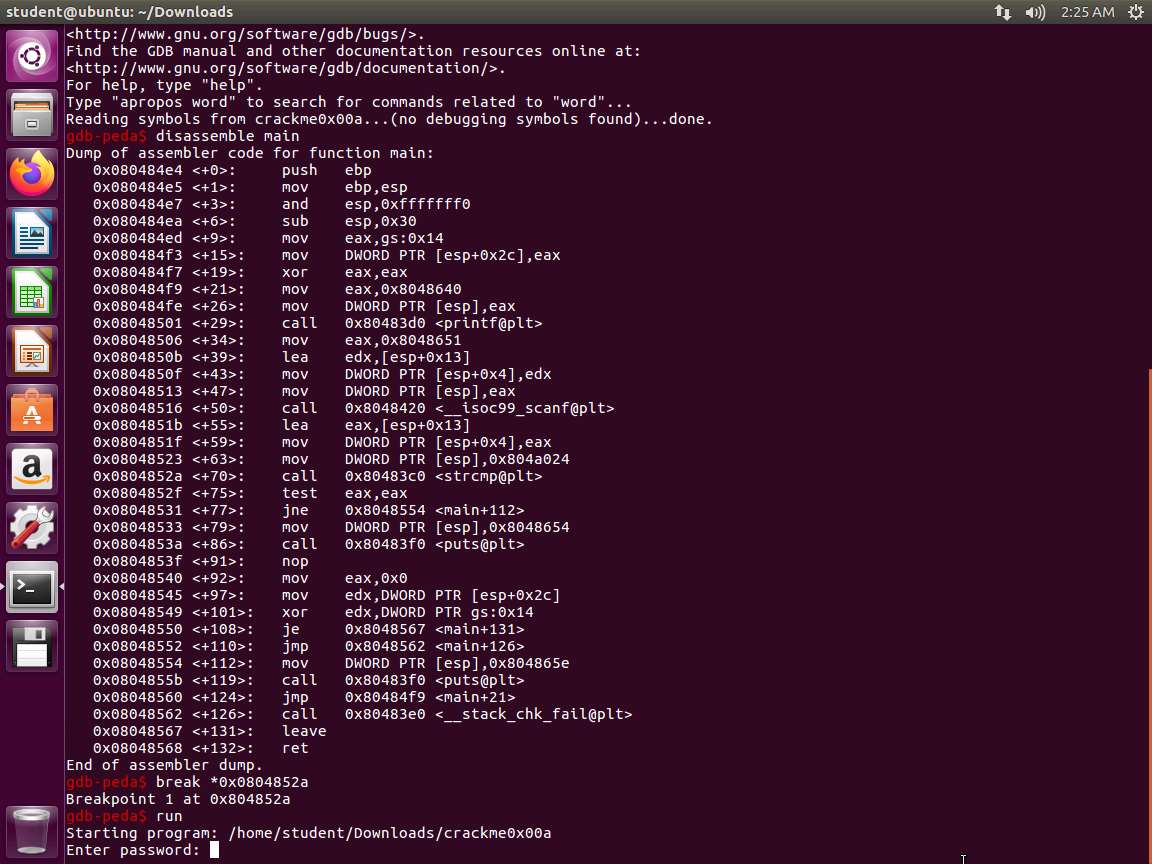
m6e1s14.jpg We want to look at the code with another tool, which we will now explore. In the terminal window, exit from Radare2 and enter gdb crackme0x00a. This will load the executable. Next, enter disassemble main. An example of the output of this command is shown in the following screenshot.
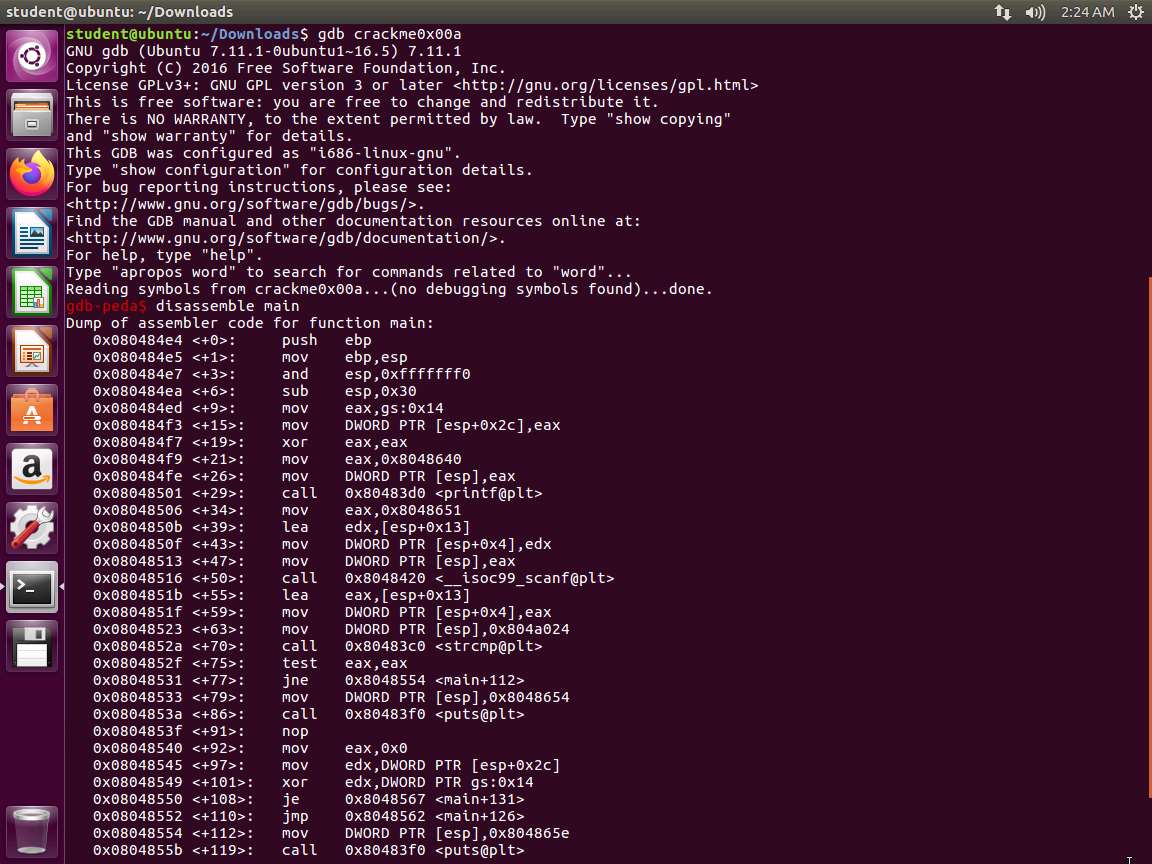
Screenshot There is a strcmp instruction on <+70>.Therefore, let us set the breakpoint at the location and run the program using the following commands.
a. break *0x0804852a
b. run
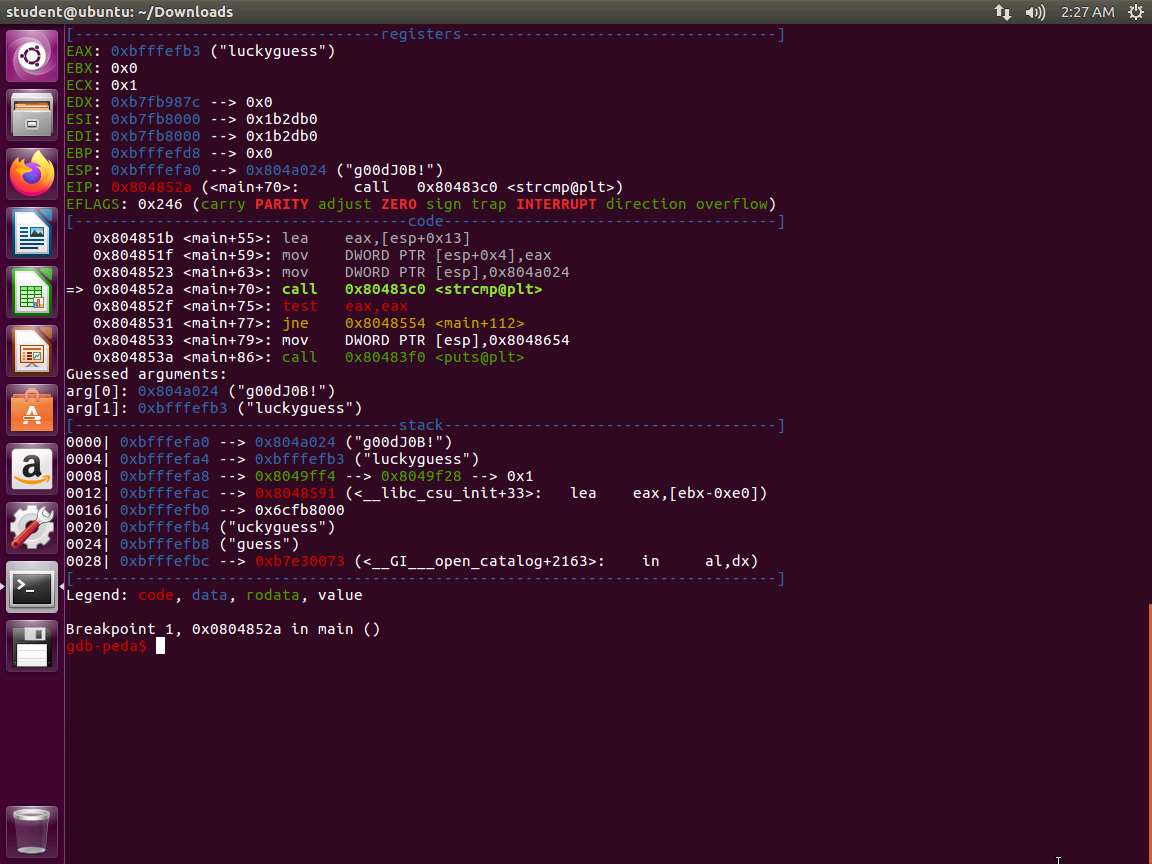
The program will run until our breakpoint. An example of this is shown in the following screenshot.
Screenshot Enter the password luckyguess. The comparison will reference the actual password as shown in the following screenshot.
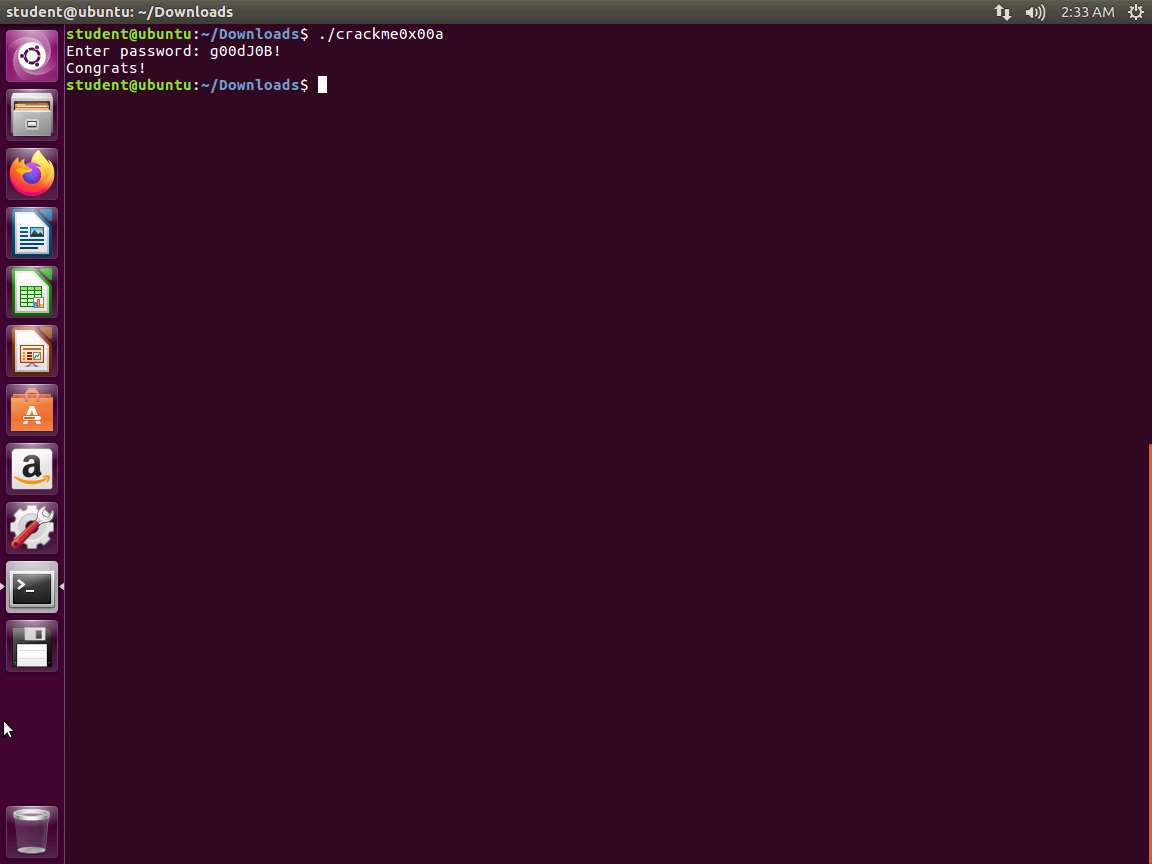
Screenshot This is successful. To be certain, we need to test the discovered password. Test the password to check whether it is correct, as shown in the following screenshot.
Screenshot In computing, both hardware and software are reverse engineered. However, in this case, we will only refer to reverse engineering software, which usually offers a compiled program that is already in its binary format. The source is not available, but we want to know how it was made, how it works, and how to change it as well.
Now that we have performed the binary analysis of this file using these tools, let us move on and try some other techniques.
We want to look at another tool. Enter edb. An example of the output of this command is shown in the following screenshot.
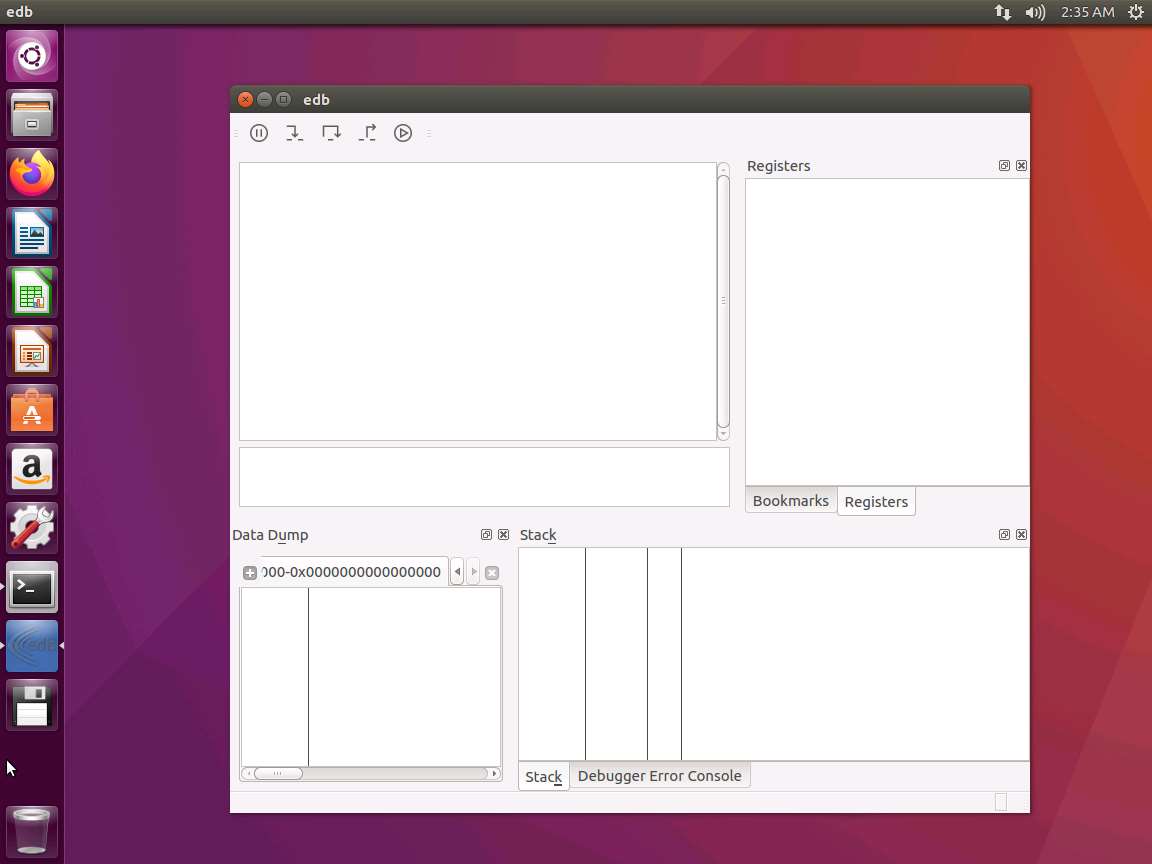
Screenshot This is the dashboard for Evan's Debugger. We have discussed edb very briefly. You are encouraged to read more here: https://github.com/eteran/edb-debugger/wiki.
Let us now explore the 32-bit code and its components. In the 32-bit VM, enter objdump -d /bin/bash. An example of the output of this command is shown in the following screenshot.
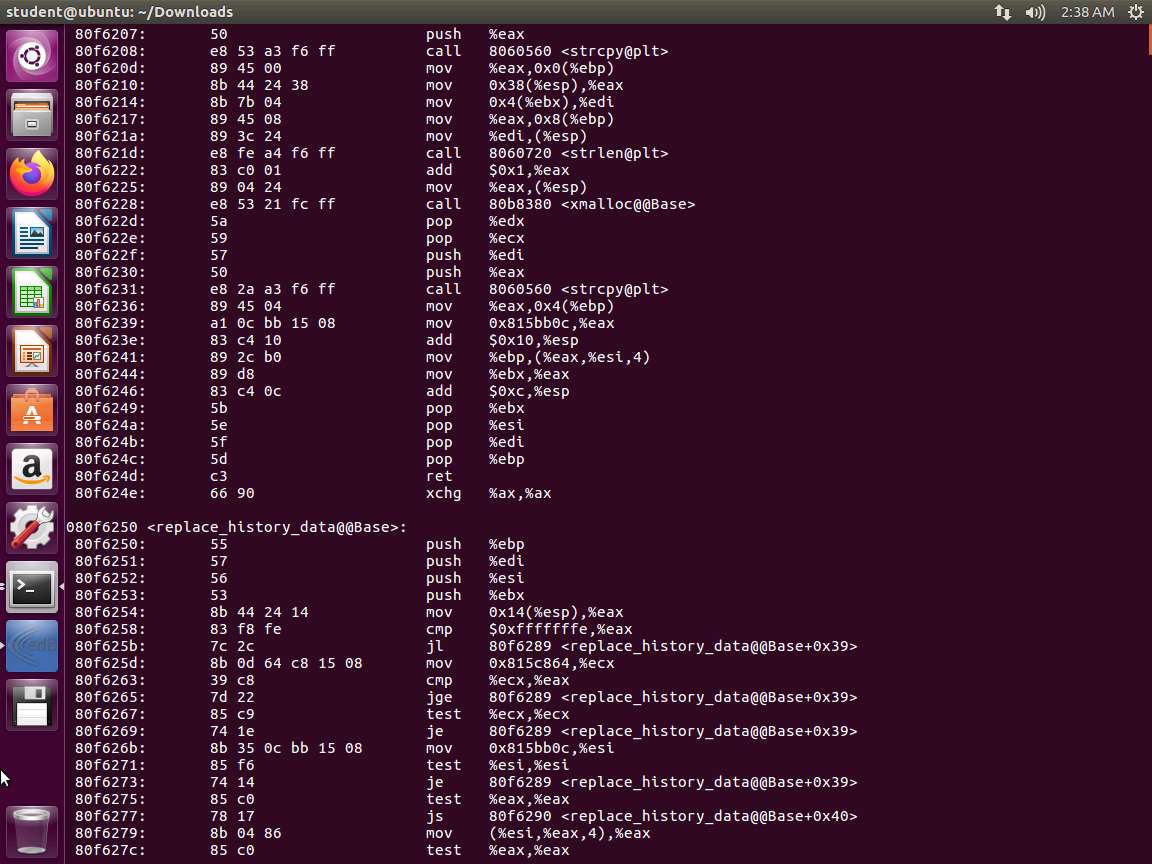
Screenshot Next, let us look at intel notation. In the terminal window, enter objdump -d -M intel /bin/bash. An example of part of the output is shown in the following screenshot.
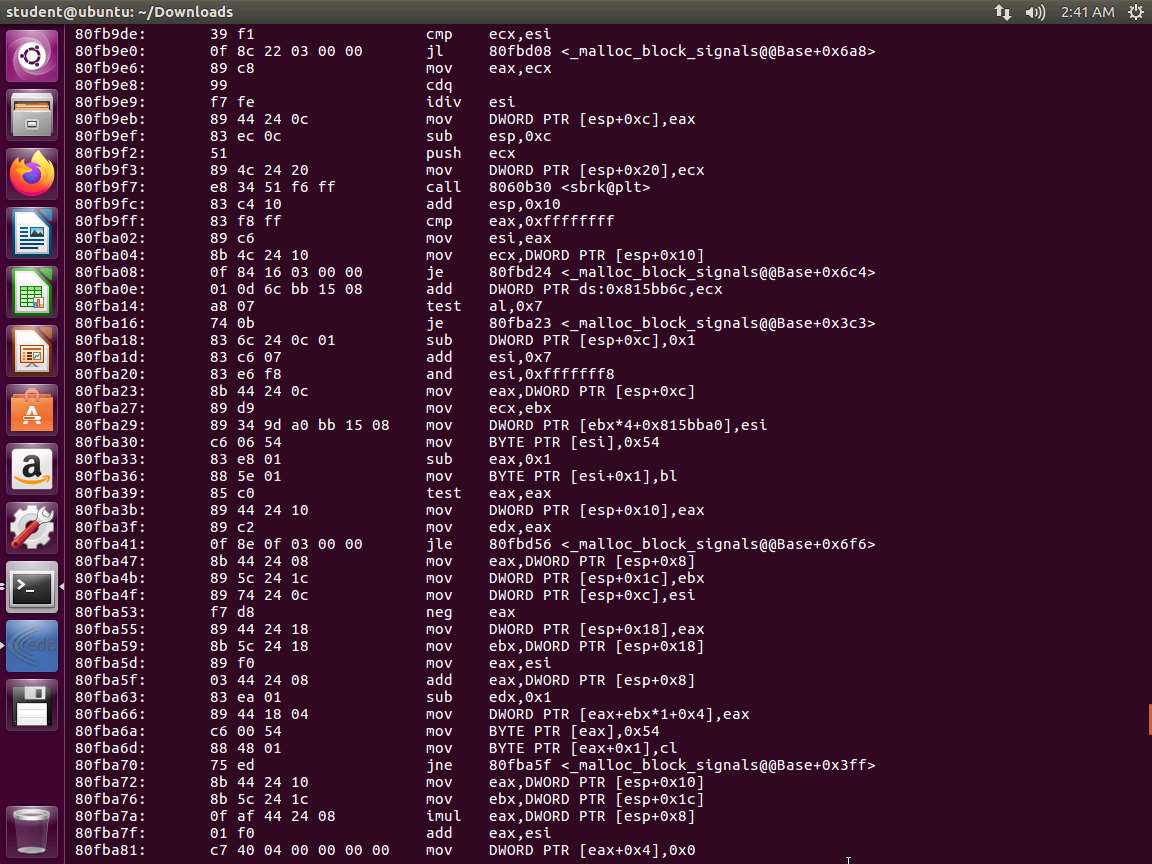
Screenshot Compare the above two screenshots. One thing that is different is the lack of a % in the intel format.
We used the objdump tool with different arguments in order to highlight the difference between the AT&T syntax and the Intel syntax for, in this case, the 32-bit version of Bash. The first command we issued used the -d command-line argument of objdump to disassemble the Bash binary. The output in the first screenshot shows, from left to right, the address of the instruction, the opcodes for the instruction and operands, the instruction itself, the source operand, a comma, and finally, the destination operand. In short, AT&T syntax is formatted as follows:
TypeCopyAT&T Syntax: <instruction> <source operand>,<destination operand>Then, we repeat the first command-line instruction but add the -M intel command-line argument, which tells the objdump tool to format the output using Intel syntax. The second screenshot is a truncated version of a much larger output and contains the same instructions as the first screenshot, except that it is formatted using the Intel syntax. Moving from left to right across the four columns, the first column shows the address in the memory of the instruction; the second column shows the opcodes for the instruction and operands; the third column shows the instruction itself; and the final column shows the destination operand, a comma, and the source operand. To summarize, the Intel syntax is formatted as follows:
TypeCopyIntel Syntax: <instruction> <destination operand>,<source operand>Fortunately, nasm will automatically understand which syntax we are using.
You may encounter several different naming conventions for 32-bit and 64-bit Intel assembly. When reading x86, x86-32, x86_32, IA32, and IA-32, know that this refers to 32-bit Intel assembly. x86-64, x86_64, IA64, and IA-64 refer to 64-bit Intel assembly. Intel, in this case, refers to the processor-specific instruction set, not necessarily the syntax format.
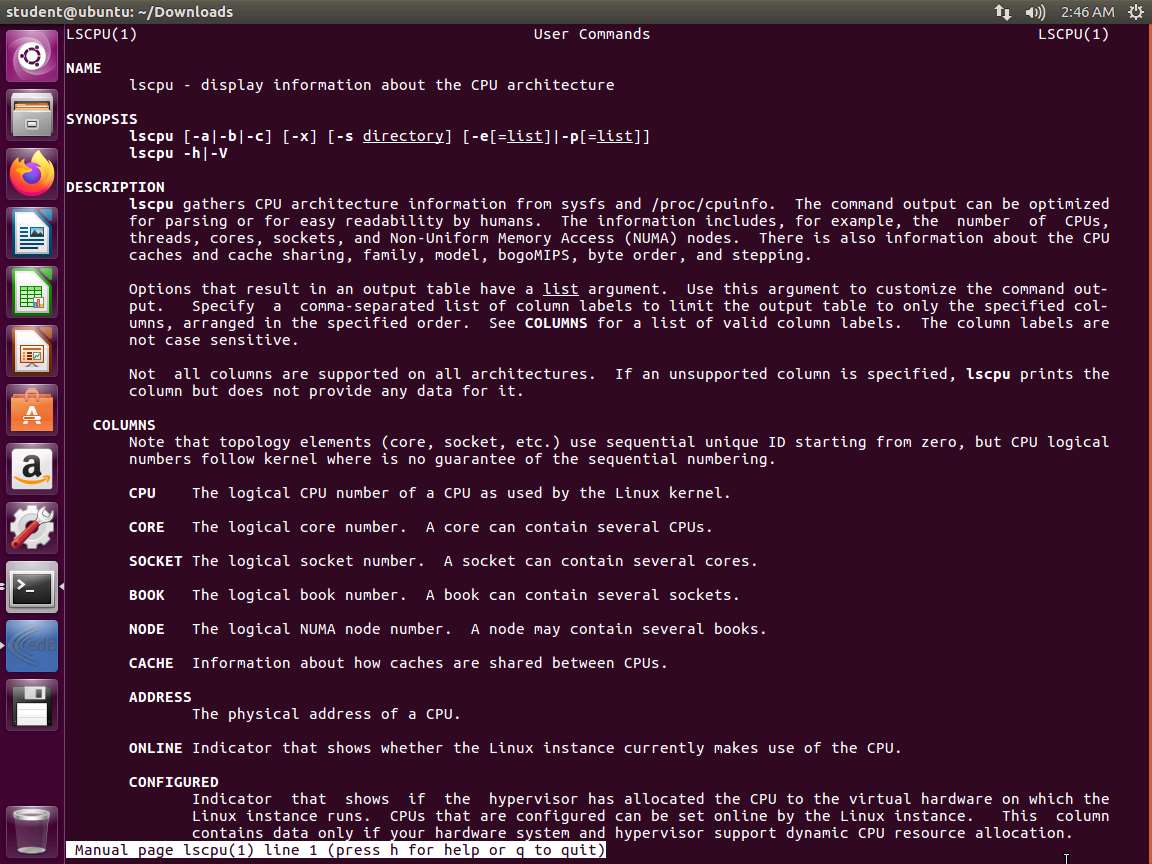
Let us now explore the different methods to extract information about the machine we are running. In the terminal window of the 32-bit virtual machine, enter man lscpu. Take a few minutes and review the information there.
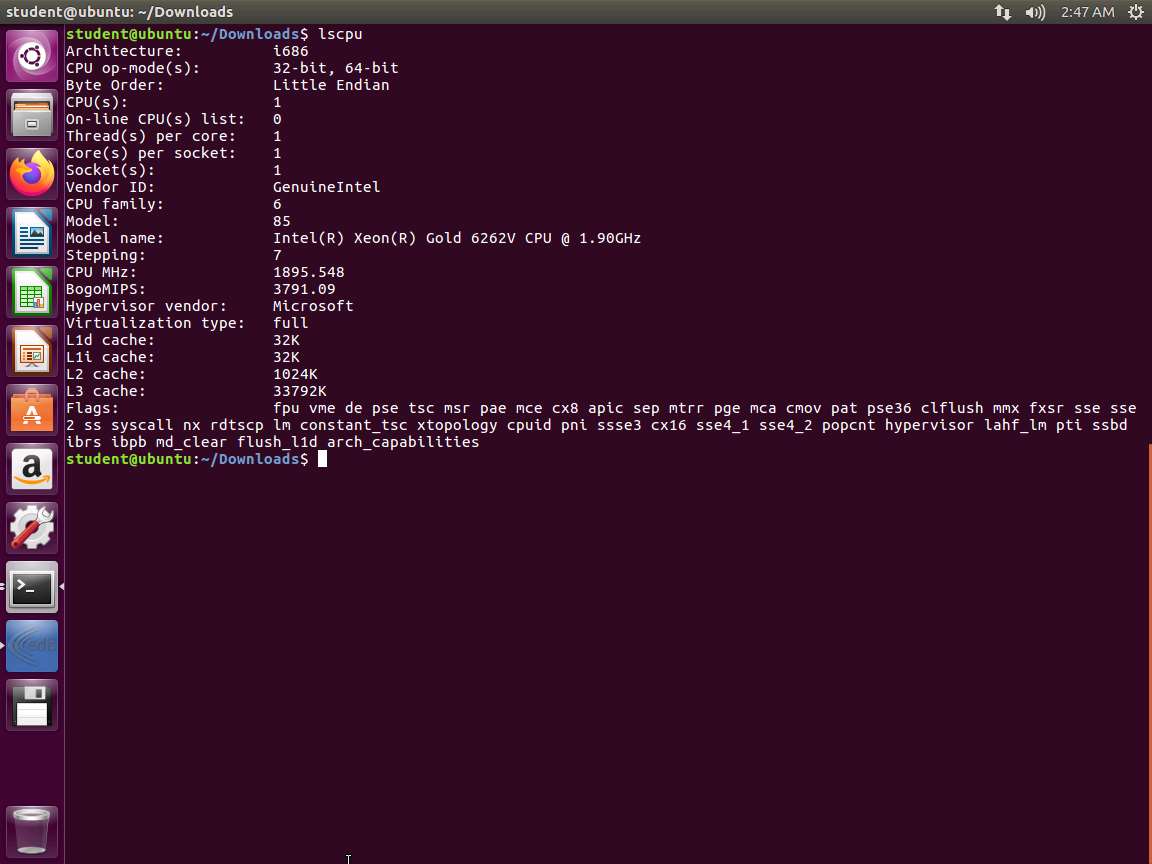
Screenshot In the terminal window, enter lscpu. An example of the output of this command is shown in the following screenshot.
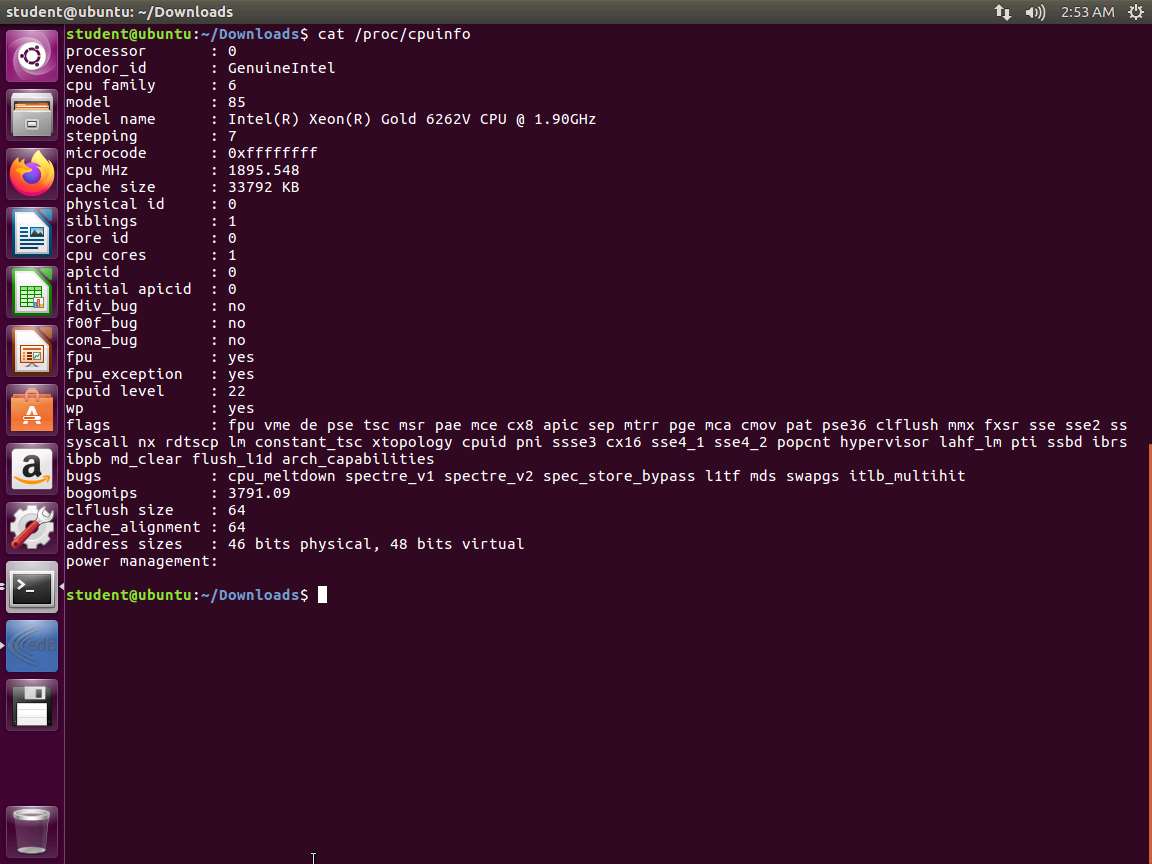
Screenshot Now, let us look at proc. In the terminal window, enter cat /proc/cpuinfo. The output of this command is shown in the following screenshot.
Screenshot Now, let us use gdb to look at the registers. In the terminal window, enter the following commands:
a. gdb -q /bin/bash
b. break main
c. run
d. info registers
An example of the output is shown in the following screenshot.
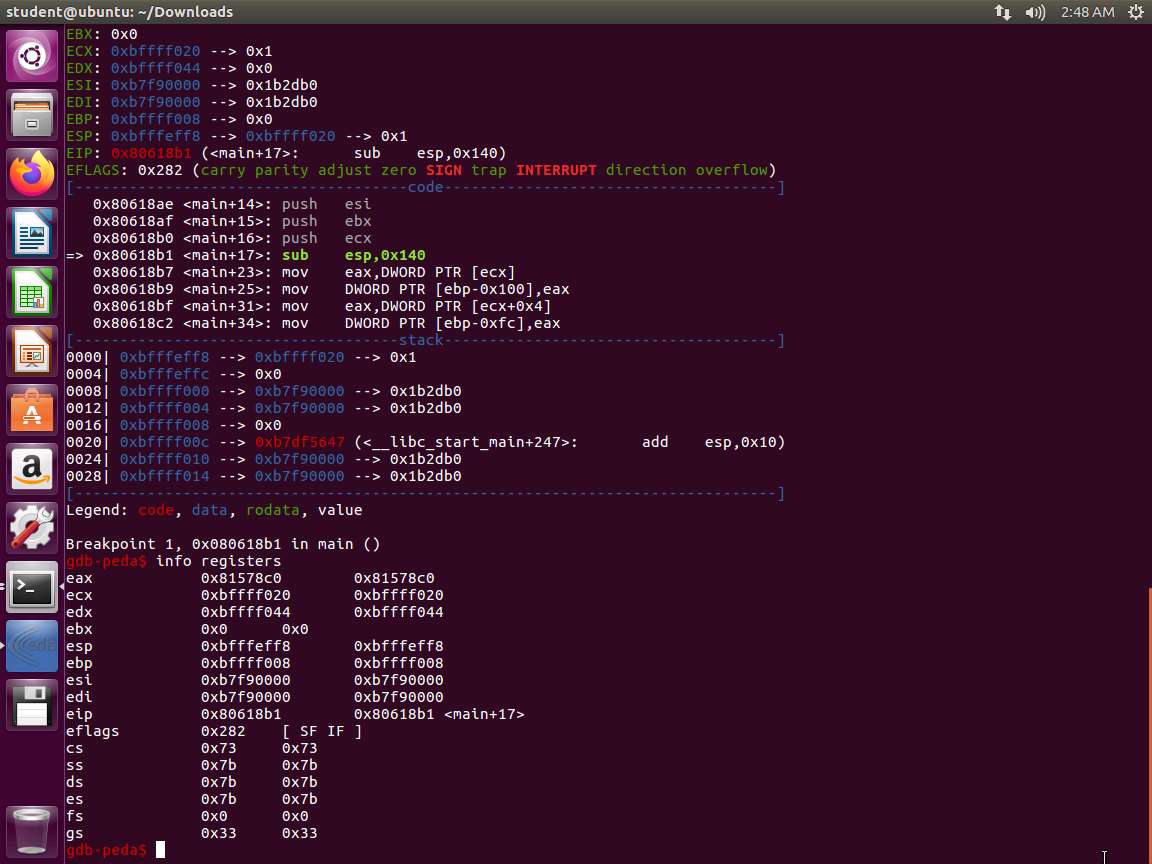
Screenshot The important part of this output is the Endianness of our processor. Little-endian means that when we are reviewing or storing data in a register or on the stack, it must be formatted with the least significant byte first. Thus, 0x12345678 will actually look like 0x78563412. This is an extremely important concept to understand and a very important piece of information to know about our processor.
When we discuss assembly and processor architectures, it is important to understand Endianness. When the least significant bit appears in our output first, it is called a little-endian. When the least significant bit is last, we call that a nig-endian. Throughout this course, we will use little-endian to display the least significant bit first when storing data in memory. This essentially means that when we deal with strings or immediate values, we need to reverse the order of the bytes. Endianness is one area that usually causes confusion, because we often forget to take it into account when analyzing binaries.
Enter quit to exit from gdb.
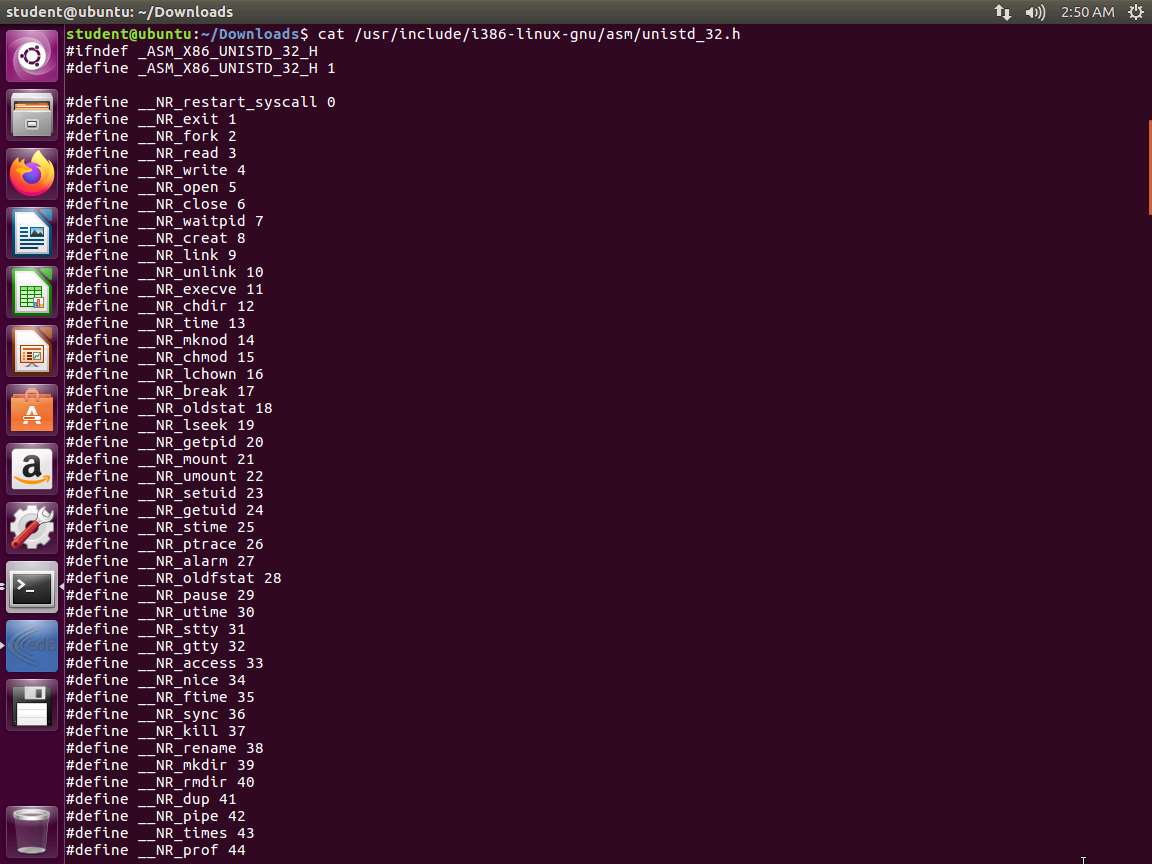
In the 32-bit machine, enter cat /usr/include/i386-linux-gnu/asm/unistd_32.h. An example of the output of this command is shown in the following screenshot.
Screenshot Open another terminal window using the shortcut SHIFT+CTRL+t.
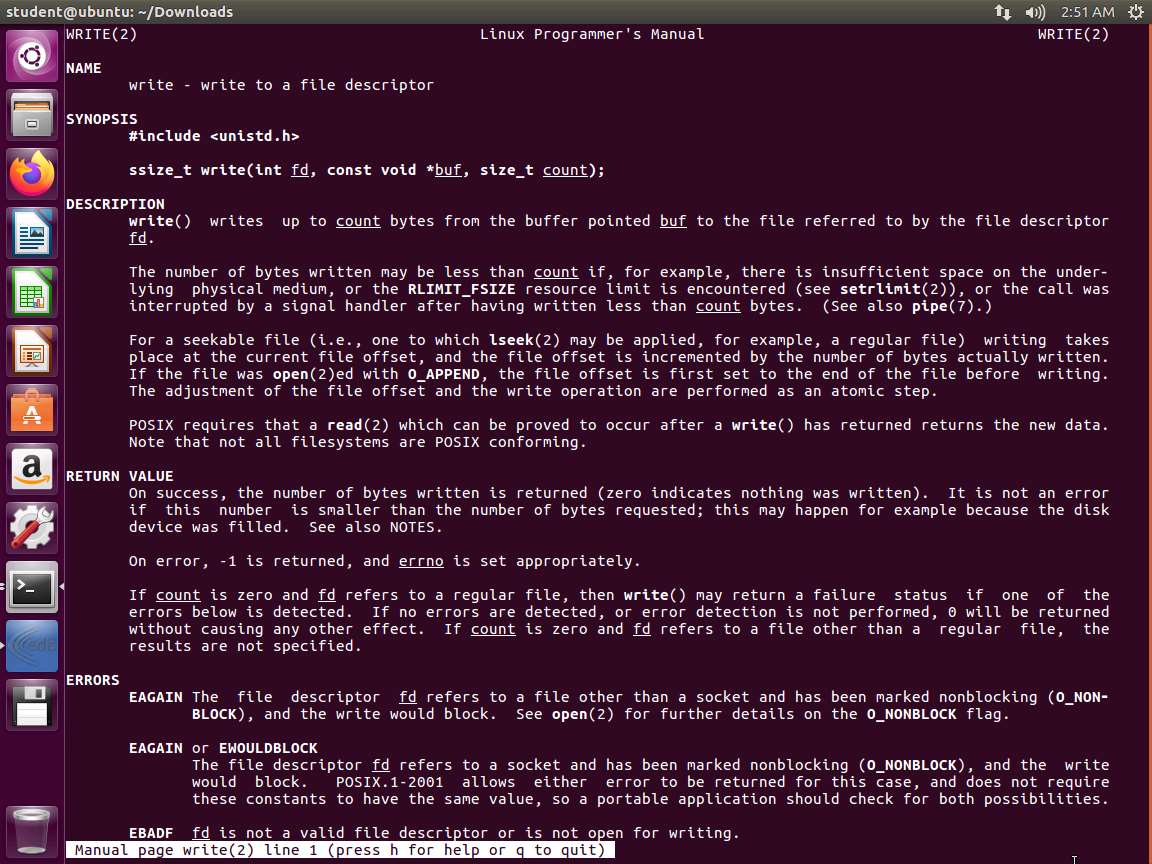
In the terminal window, enter man 2 write. Take a few minutes and review the information in the man page.
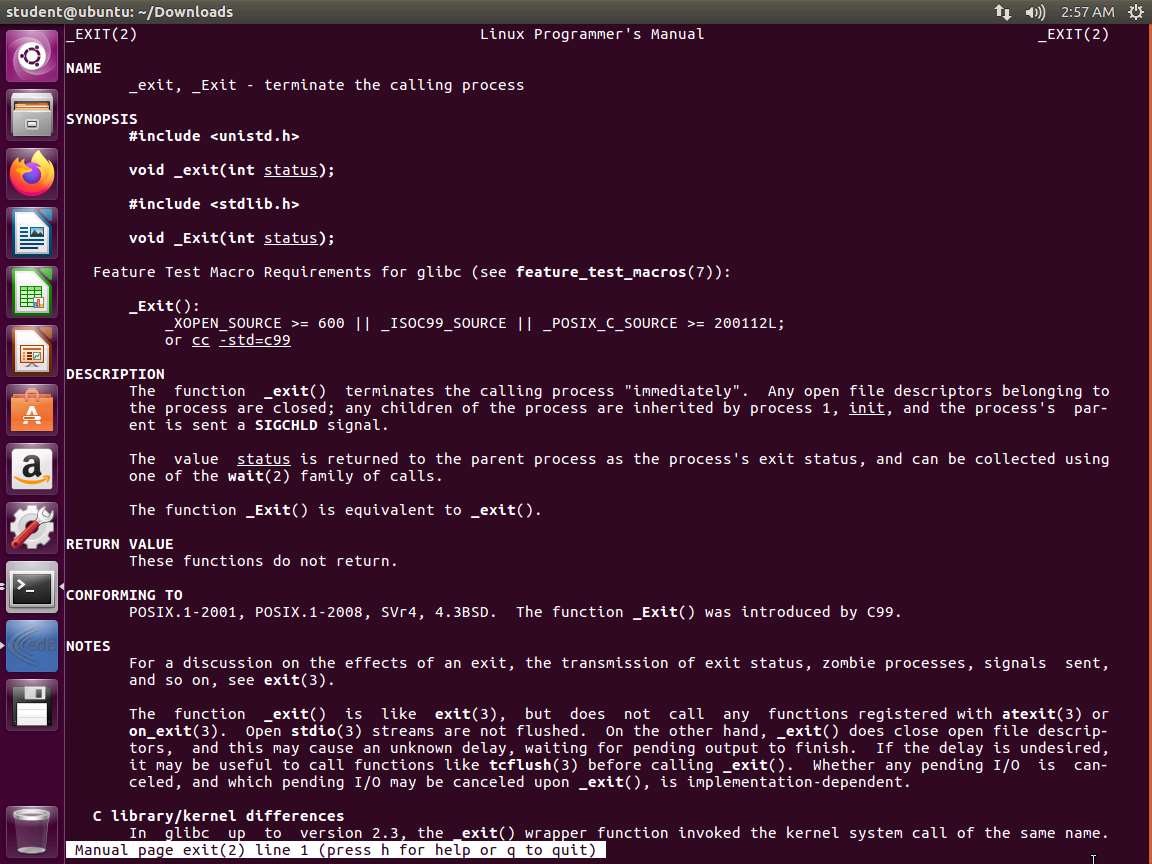
Screenshot Open another terminal window. Next, enter man 2 exit. Take a few minutes and review the information in the man page.
Screenshot We are ready to create a small assembly program. Open a text editor of your choice and enter the following:
TypeCopyglobal _start

section .text

_start:
    ; write(int fd, const void *buf, size_t count)
    xor    eax,eax
    xor    ebx,ebx
    xor    ecx,ecx
    xor    edx,edx
    mov    al,0x4
    inc    bl
    push   0x000a2164
    push   0x6c726f57
    push   0x202c6f6c
    push   0x6c6548
    mov    ecx,esp
    mov    dl,0xf
    int    0x80
Save the files as code-one.asm, and ensure that the indentations are the same as in the example.
Next, enter the following commands:
a. nasm -f elf32 -o code-one.o code-one.asm
b. ld -o code-one code-one.o
c. chmod +x code-one
d. ./code-one
An example output of this command is shown in the following screenshot.
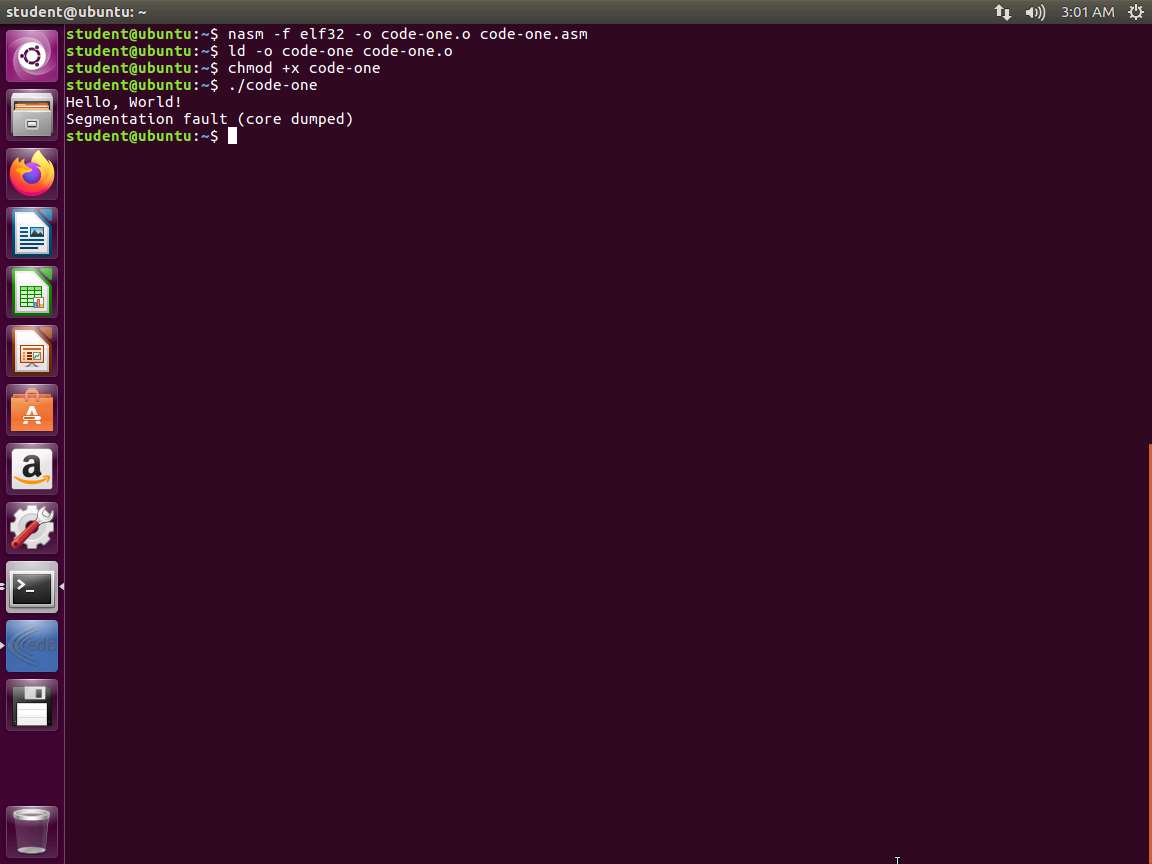
Screenshot As you see, it takes a lot of assembly to create a simple program, so this is one of the reasons why the C language is so popular.
When reviewing disassembled binaries, we may see terms such as byte, word, double word, quad word, and double quad word. These terms represent 8 bits, 16 bits, 32 bits, 64 bits, and 128 bits, respectively.
When studying a disassembled binary's output, it is also important to understand how the width of the data within an operand may impact the instruction syntax. For example, PUSH may become PUSH WORD when pushing a 32-bit wide piece of data onto the stack.
This program is based on the ELF-32 (executable and linking format). We will now extract information from the program so that we can understand it better.
As with anything, reading the man page is a good start. Enter man elf.
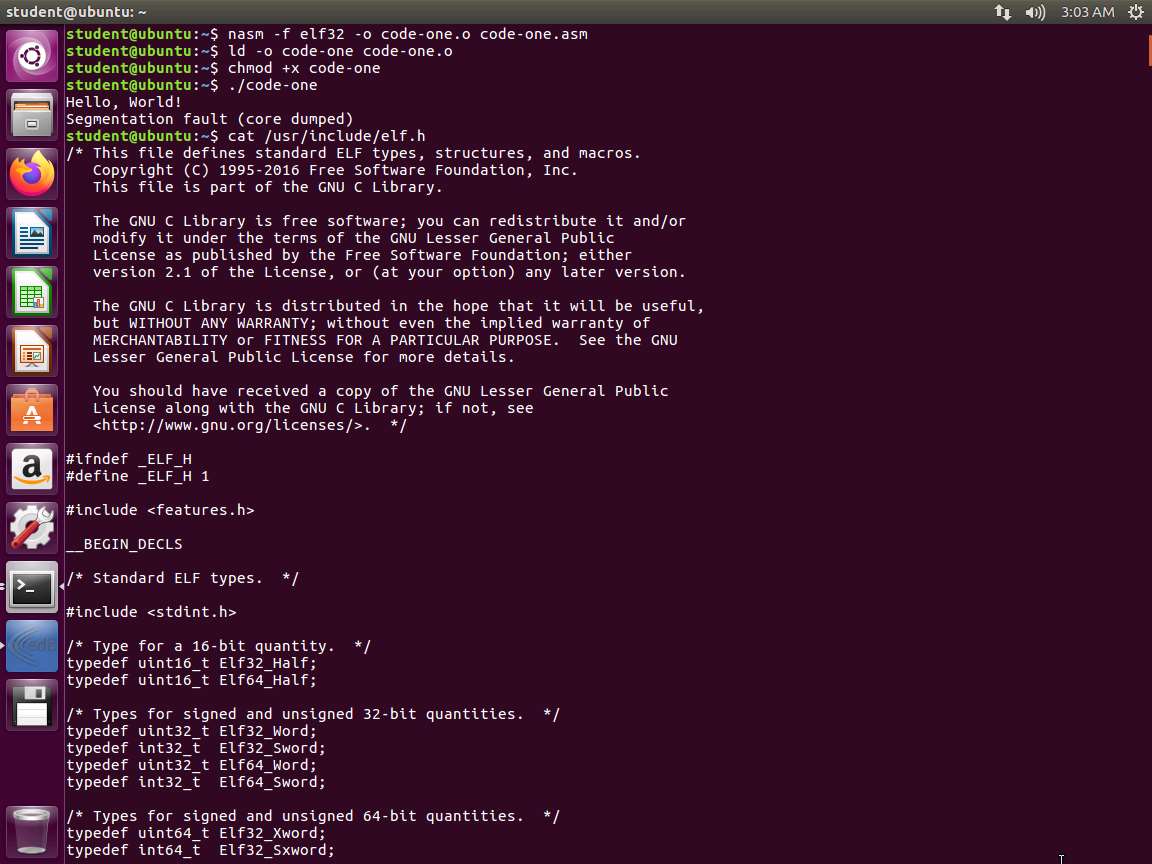
Take a few minutes and read the information contained within the man page. Once you have exited the man page, enter cat /usr/include/elf.h. The output of this command is shown in the following screenshot.
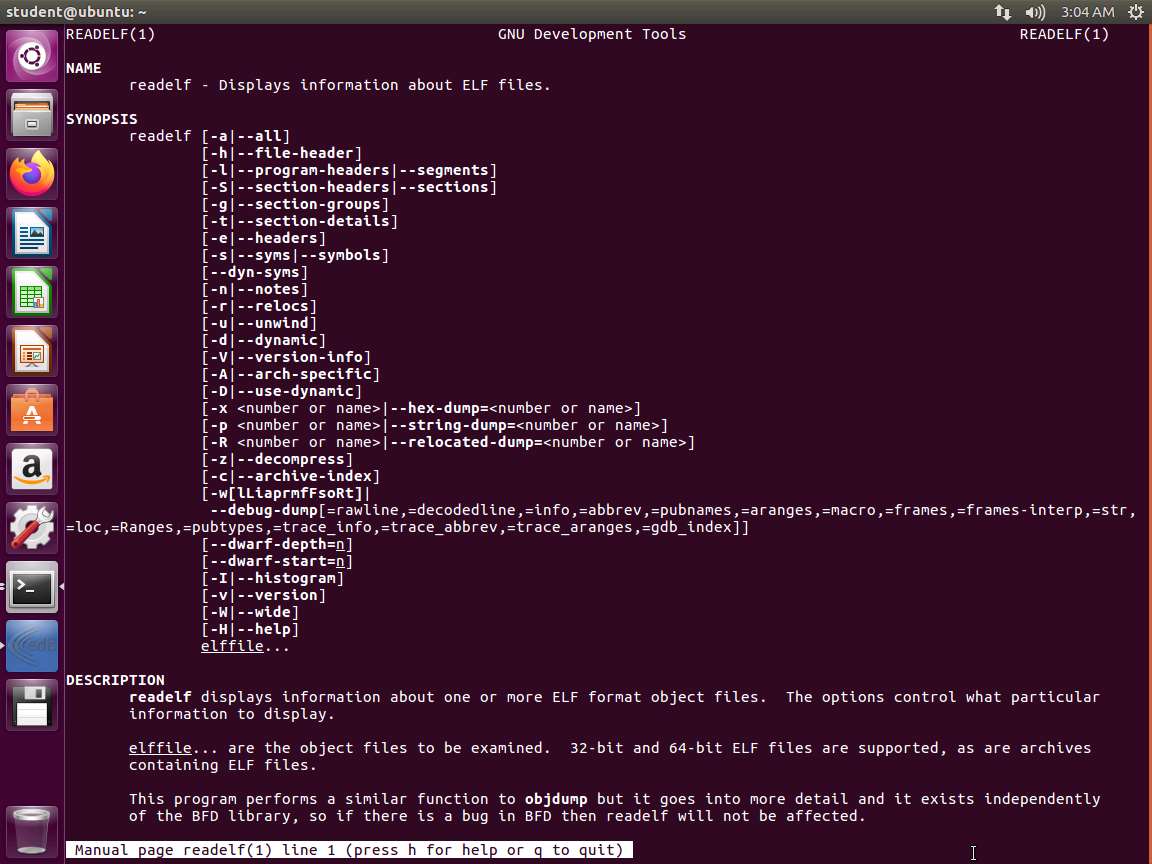
Screenshot Now we are ready to learn more about ELF files. Enter man readelf. An example of the output of this command is shown in the following screenshot.
Screenshot Next, let us review our code with this tool. Ensure that you are in the folder where you created your program, and enter readelf -h code-one. The output of this command, including the start with the ELF Header, is shown in the following screenshot.
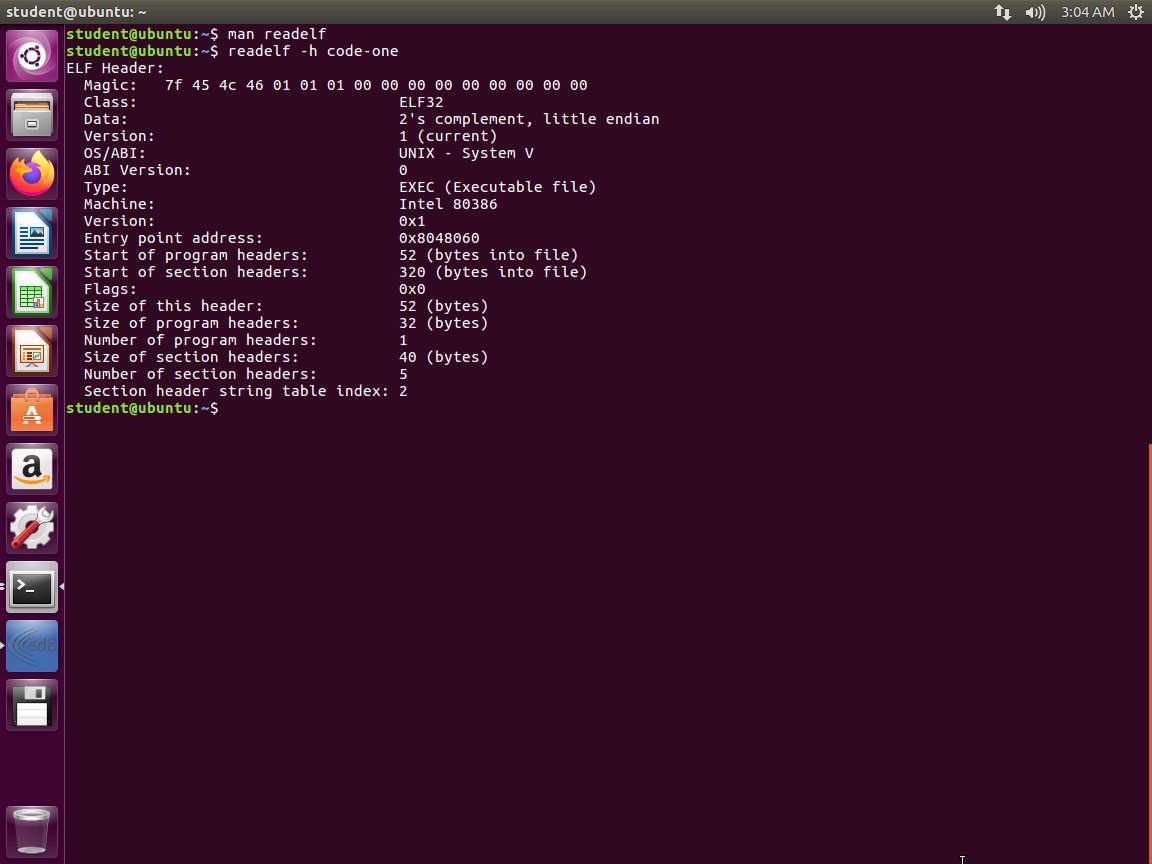
Screenshot The Magic is the 7f, start of the ELF header and 45 (E), 4C(L) and 46(F). So, it starts with ELF. The next number 01 means we have 32 bytes. If we had 64, it would be a 02. Then, the next 01 is for little- endian and a value of 02 would be for big-endian.
Next, we want to examine the object file. Enter readelf -h code-one.o. An example of the output of this command is shown in the following screenshot.

Screenshot As we can see in the screenshot, Type is REL, so this is a relocatable file. As such, there are no program headers. The executable image program headers start 52 bytes in; there are none, so the start is 0.
Next, we will look at the listing. Enter readelf -l code-one (that is a n "el"). An example of the output of this command is shown in the following screenshot.
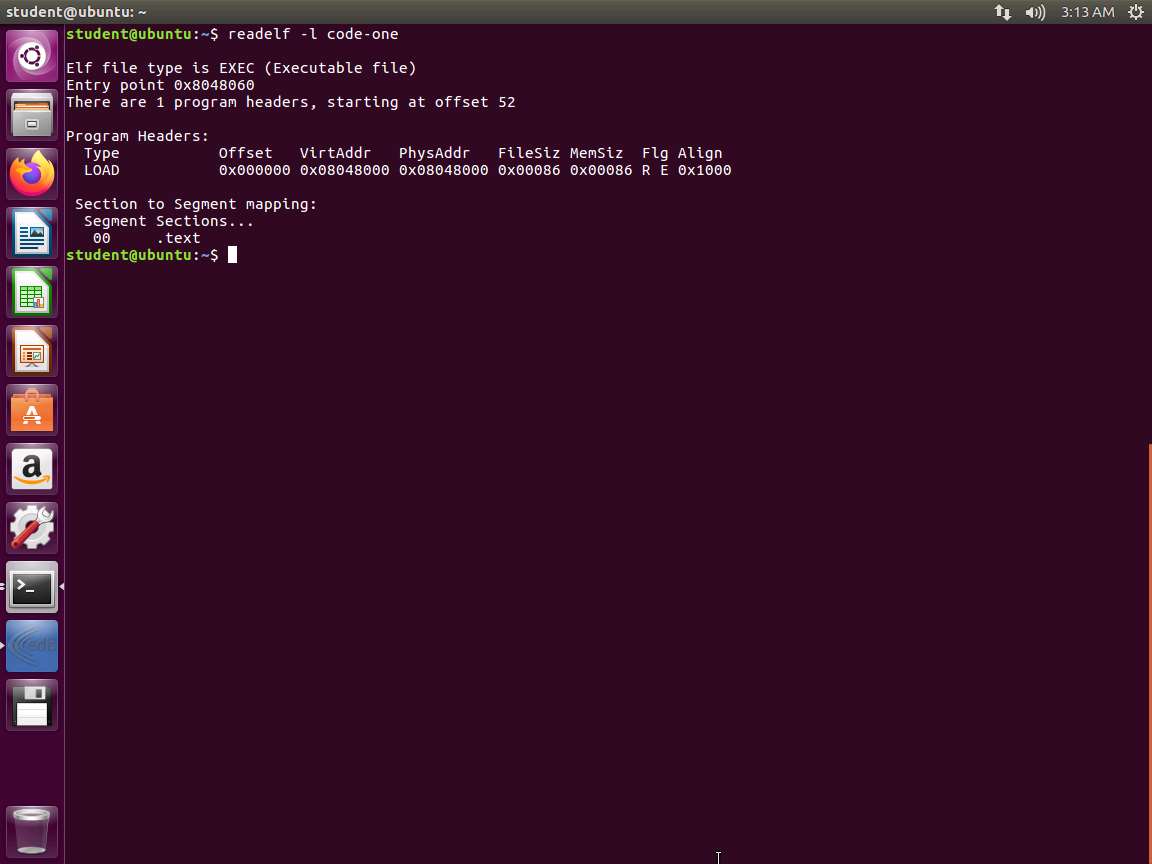
Screenshot The program header is visible in the screenshot. It starts at virtual address 0x08048000, physical address 0x08048000, has a file size of 0x00086 (142) bytes, and takes up the same amount of memory. It is set with the R and E flags, indicating that segment is set with the permissions read/execute and requires a memory alignment of 0x1000 (4096) bytes. We can also see which sections are mapped to the segment, which is indicated in the program header table. This is the executable .text section.
Next, enter readelf -S code-one. An example of the output of this command is shown in the following screenshot.
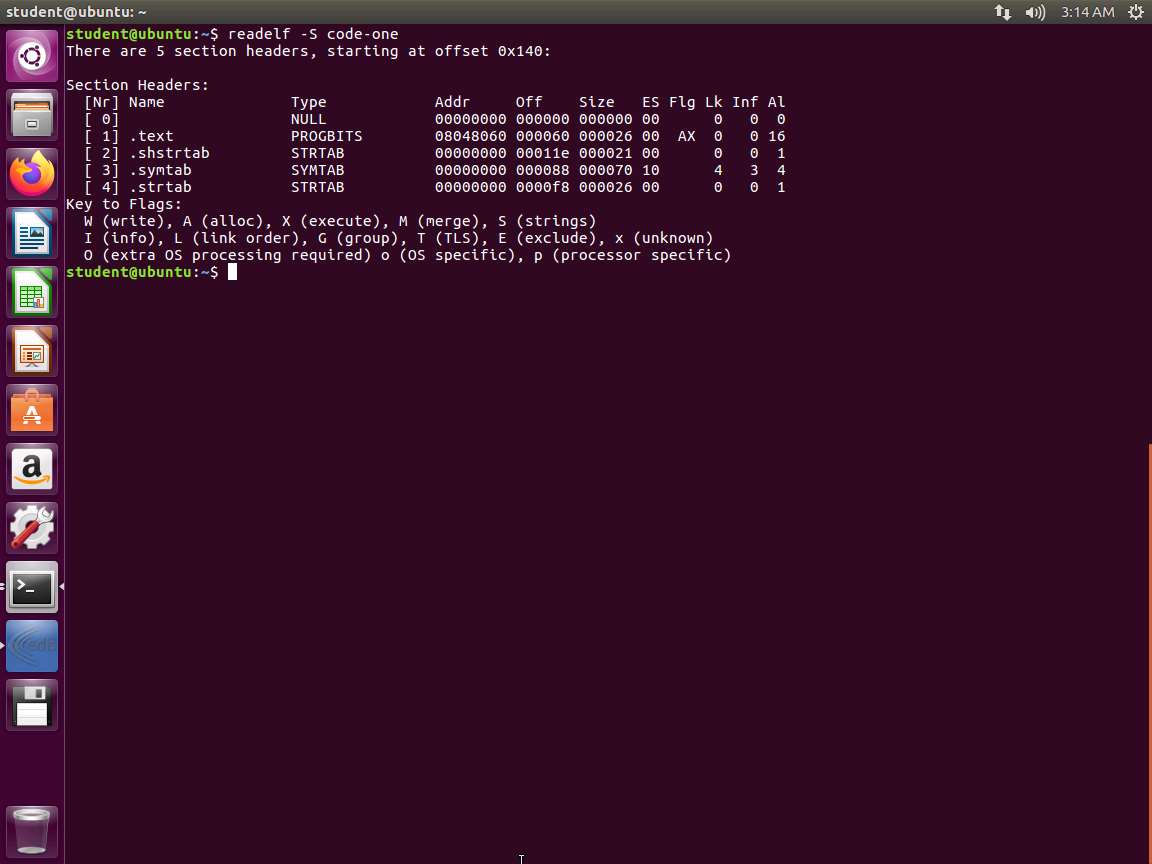
Screenshot This screenshot shows the section headers. We can see that for the .text section, the type is indicated as PROGBITS and is marked as executable (X). The PROGBITS type indicates that this section contains program data. This is because we coded the program in the .text section.
Next, enter readelf -s code-one. An example of the output of this command is shown in the following screenshot.
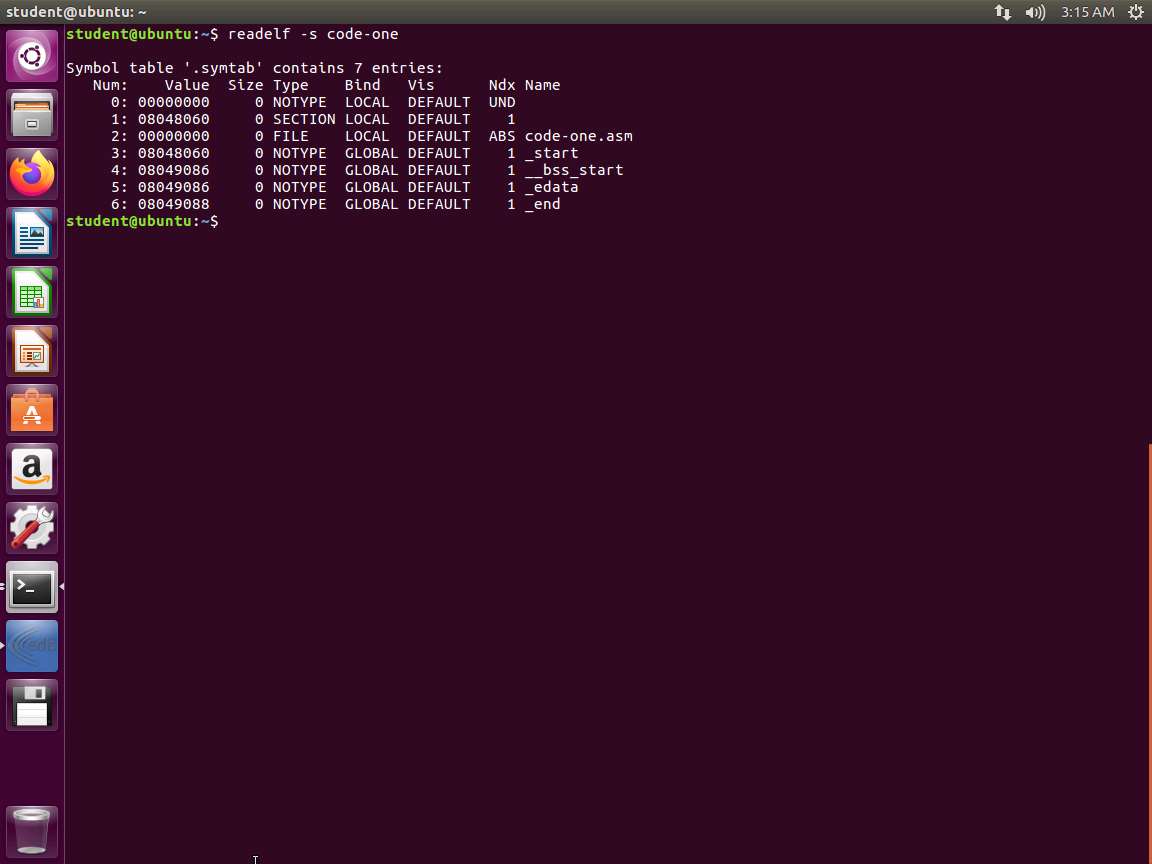
Screenshot This screenshot shows the symbol table. We have the string table index, the memory location of the symbol itself, the size of the symbol is in bytes, the type of symbol, the symbol's binding, whether it is visible or not, the section index, and the symbol name. Notice that we recognize at least two entries in our output: the _start symbol, marked GLOBAL, and the name of our file.
Next, let us look at the .text info. Enter readelf -R .text code-one. An example of the output of this command is shown in the following screenshot.
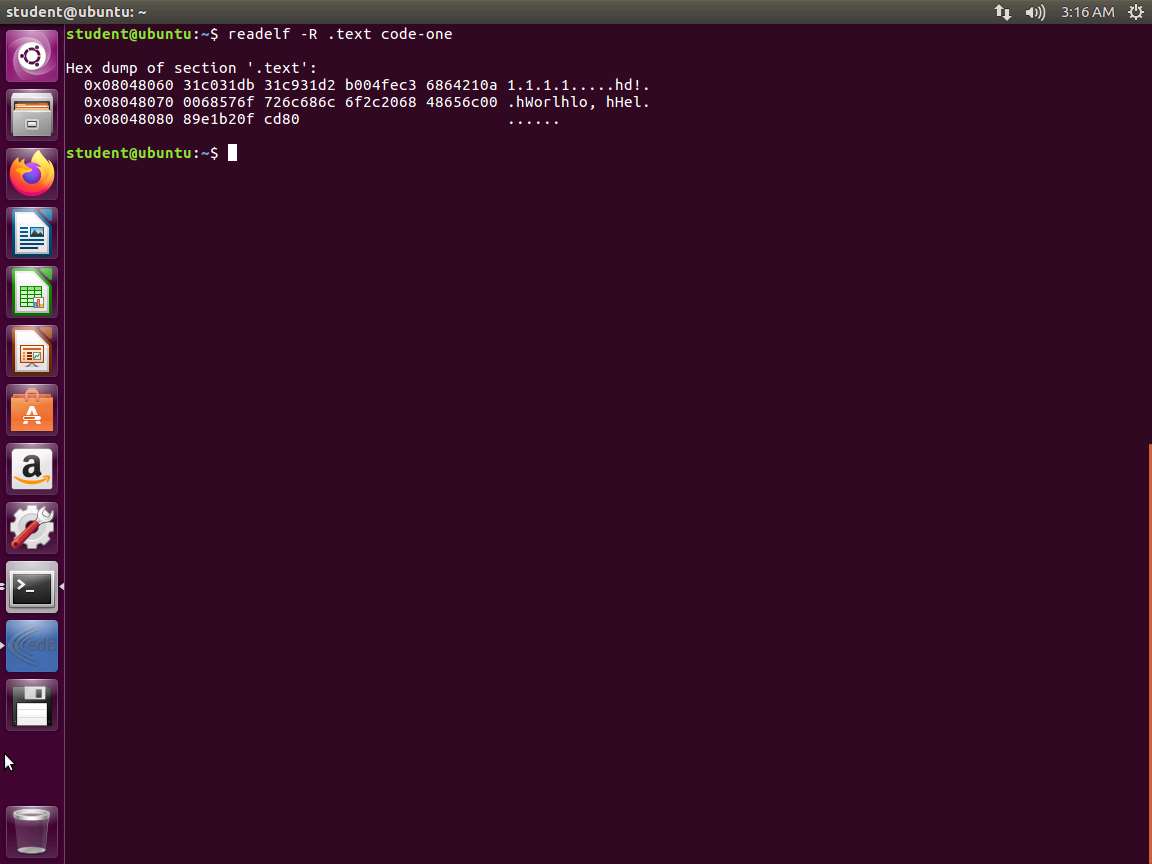
Screenshot This screenshot shows the relocated bytes.
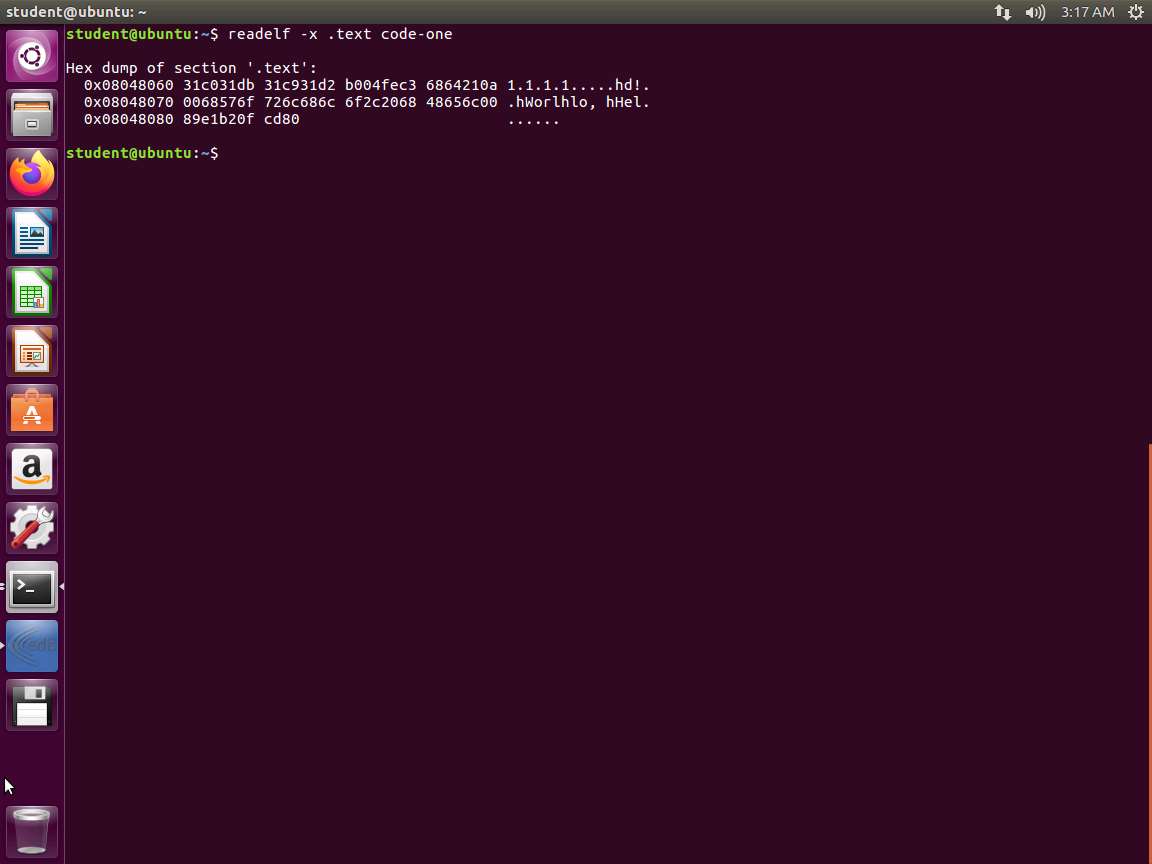
Next, enter readelf -x .text code-one. The output is the same as the previous command, but this option dumps the hexadecimal.
Screenshot The lab objectives have been achieved.
Last updated