
10. Reverse Engineering a Binary with Ghidra
Exercise 10: Reverse Engineering a Binary with Ghidra
We are going to look at the powerful tool Ghidra that was created by the US National Security Agency, which was released to the public. It is one of many open source software (OSS) projects developed within the National Security Agency
Lab Tasks
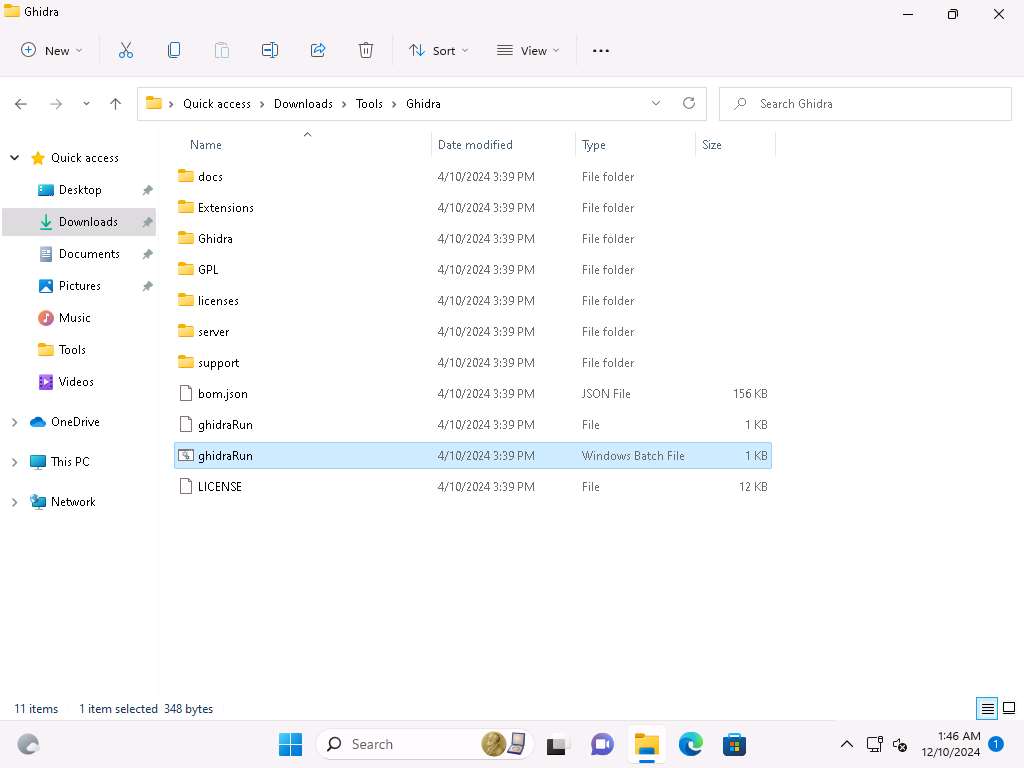
Click on Windows 11 to switch to Windows 11 machine, and navigate to C:\Users\Admin\Downloads\Tools\Ghidra and double-click the Ghidarun.bat file.
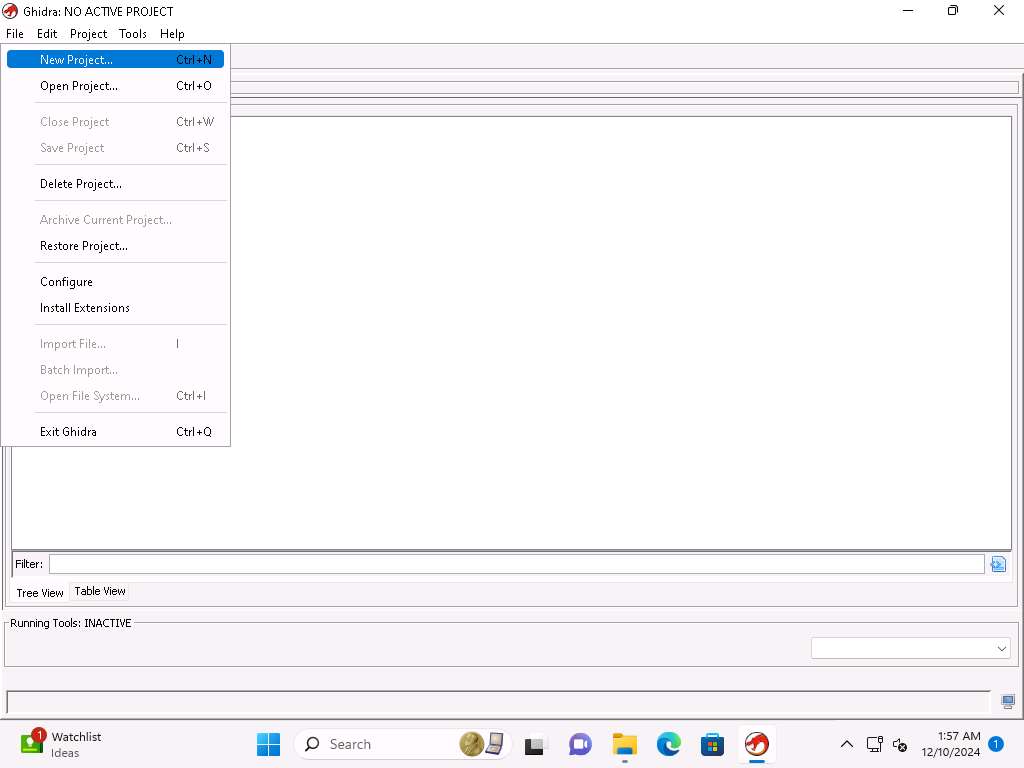
Screenshot Ghidra window appears, click on File-> New Project.
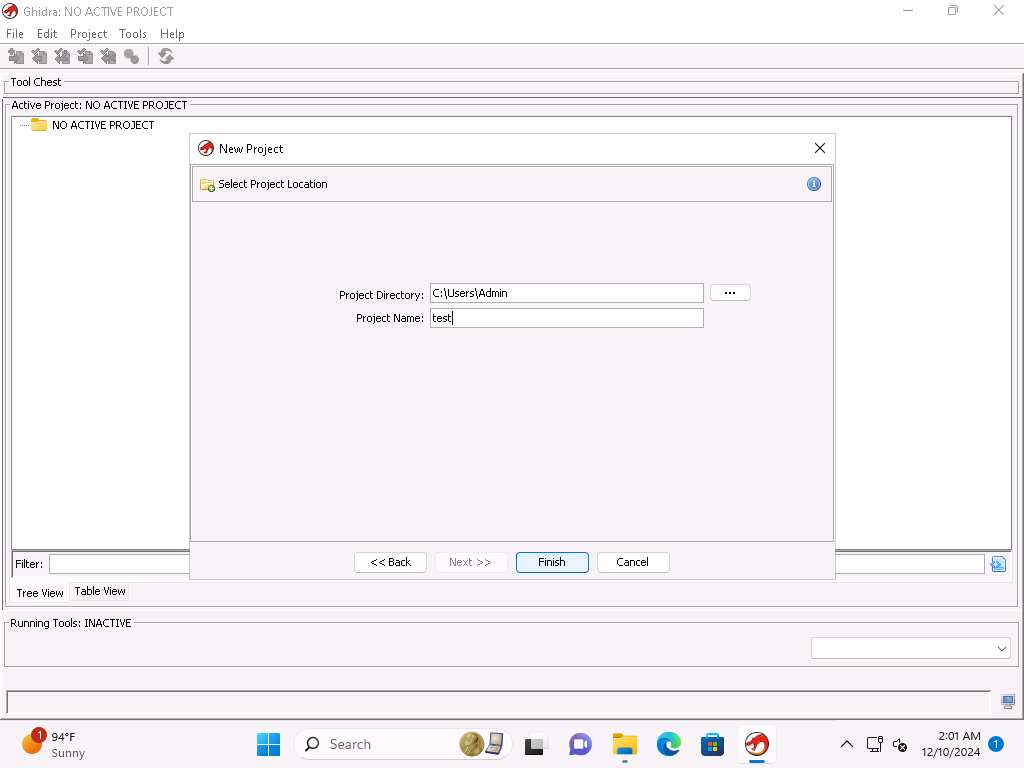
Screenshot Accept the default of non-shared project and click on Next, enter a name of your choice, here in the exercise we will enter test.
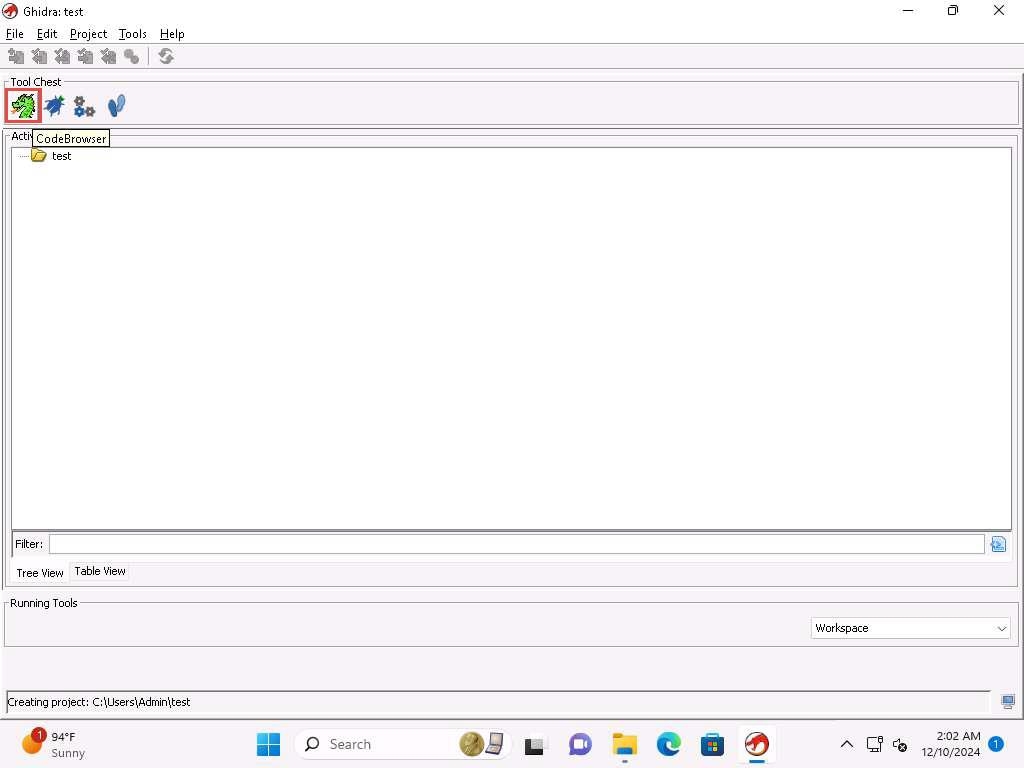
Screenshot Click on the code browser,
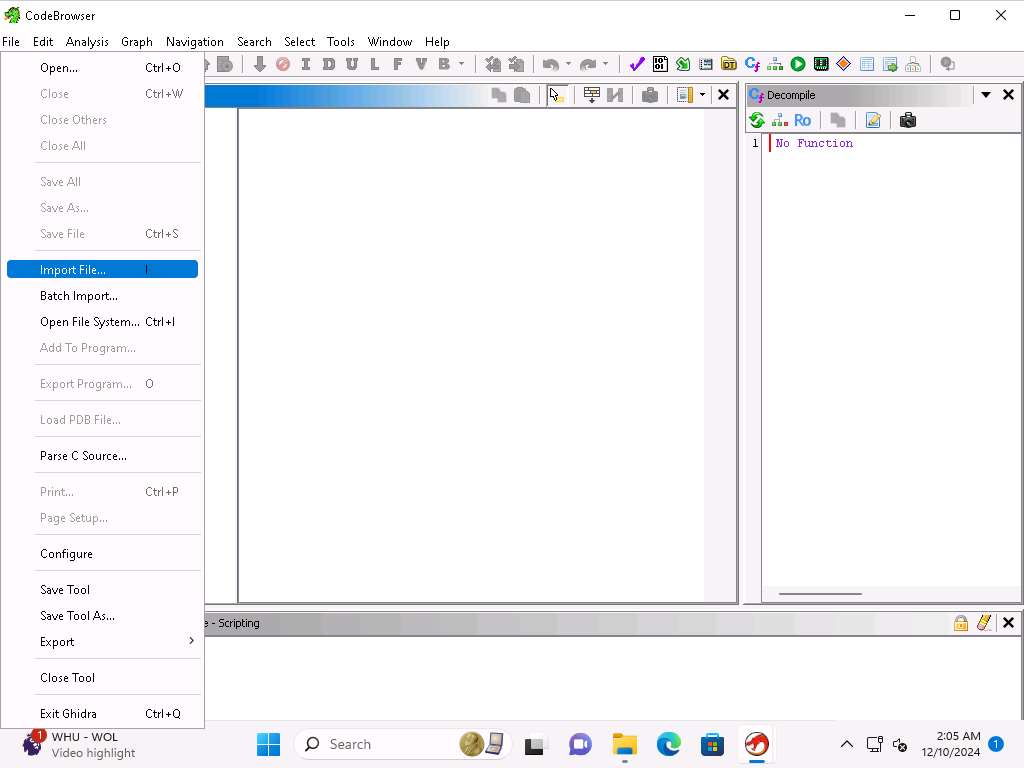
yh229o5n.jpg Now, click on File --> Import File and navigate to C:\Users\Admin\Downloads\ABO2_con_simbolos folder and select ABO2.exe and click Select File to Import button.
Screenshot 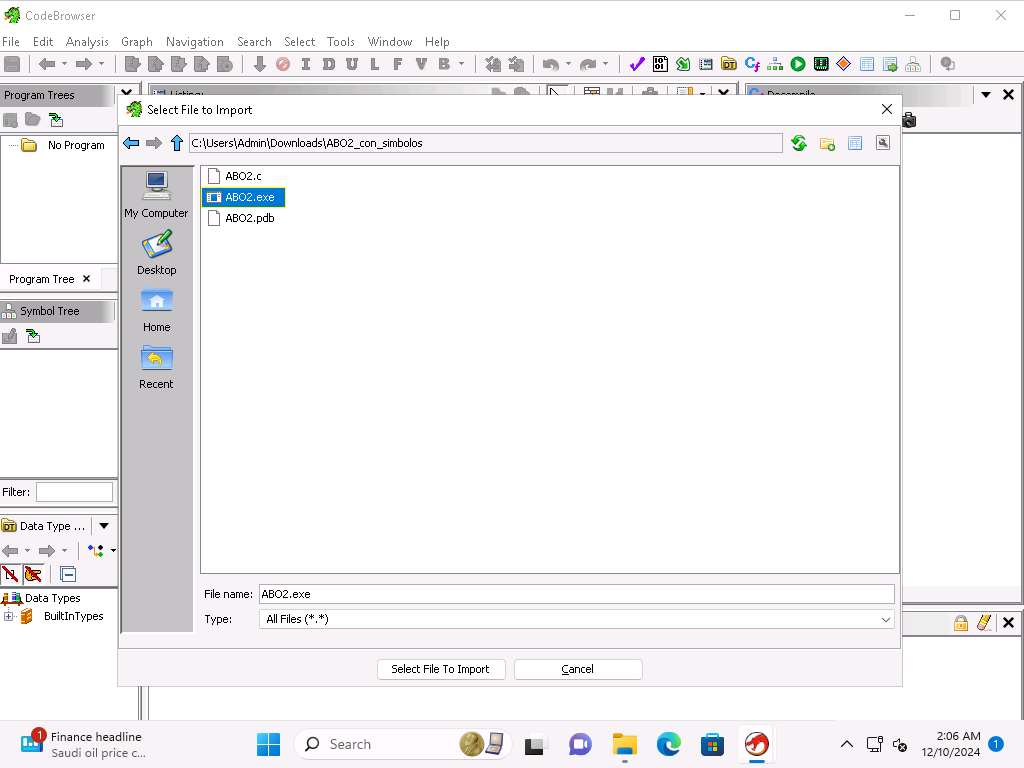
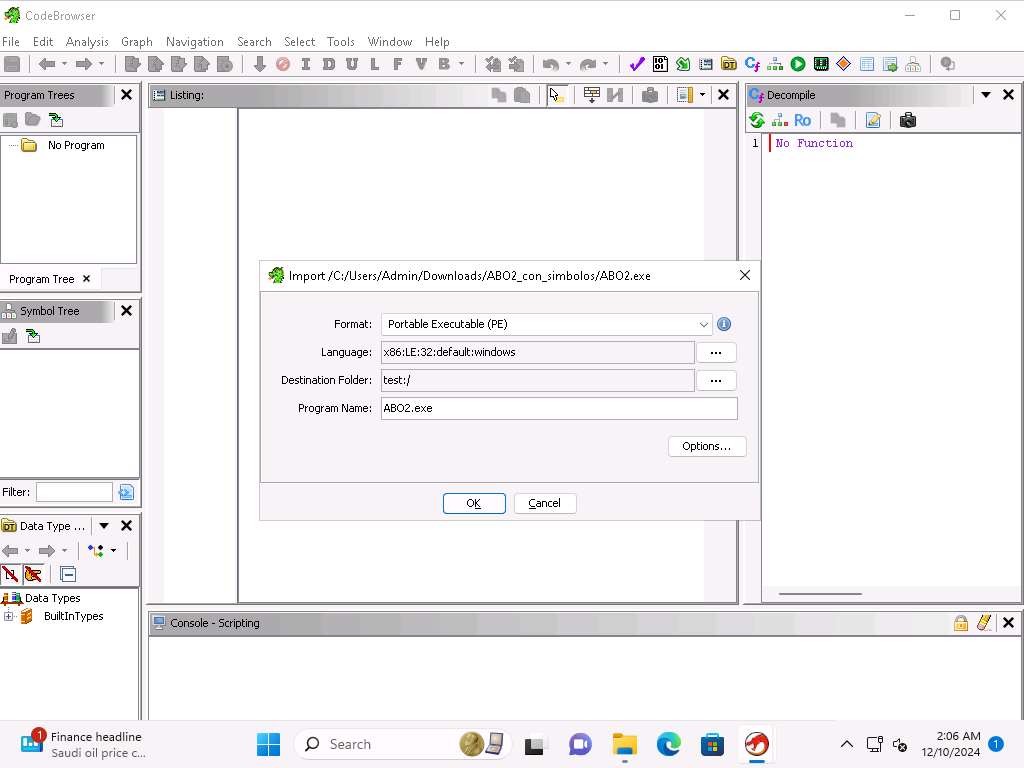
Screenshot Click OK in the Import pop-up, wait for the file to import.
If a Windows Security Alert pop-up appears, click Allow Access.
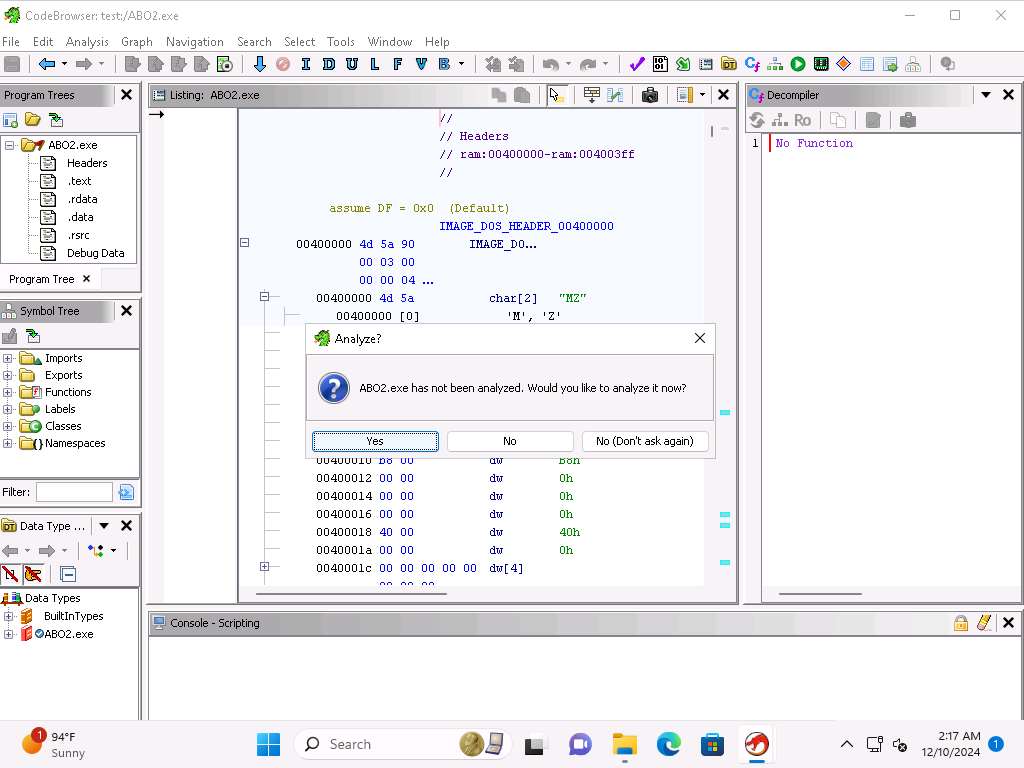
Screenshot In the Analyze? window, click Yes button.
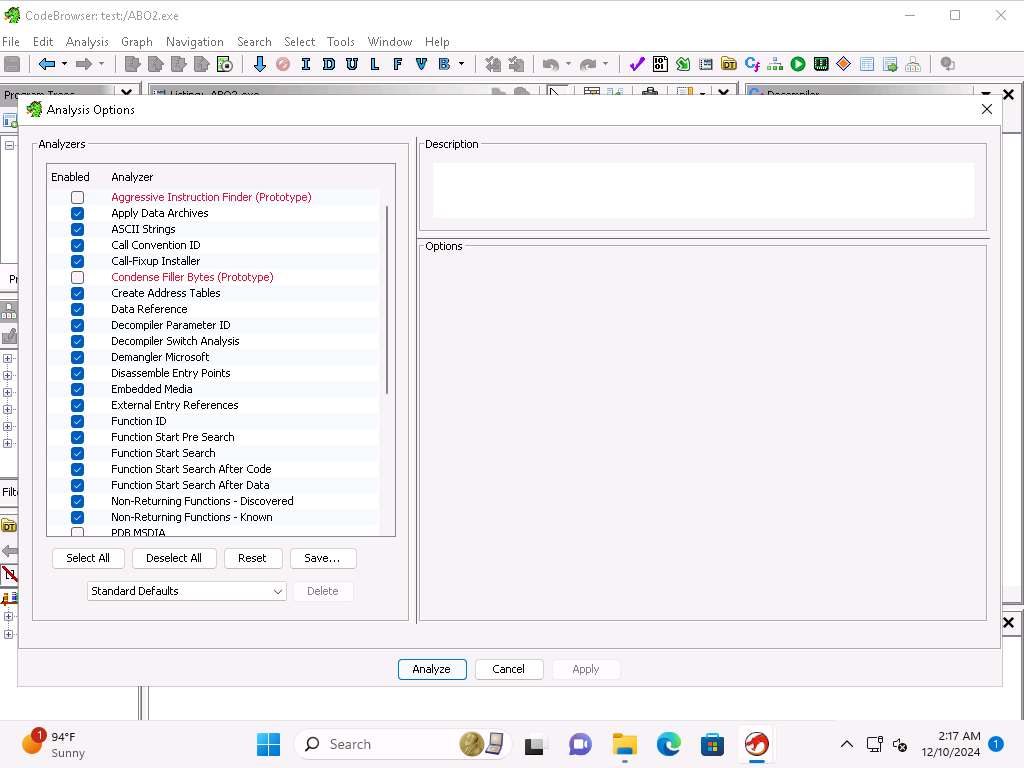
Screenshot In the Analysis Options window, keep all the selections to default and click on Analyze.
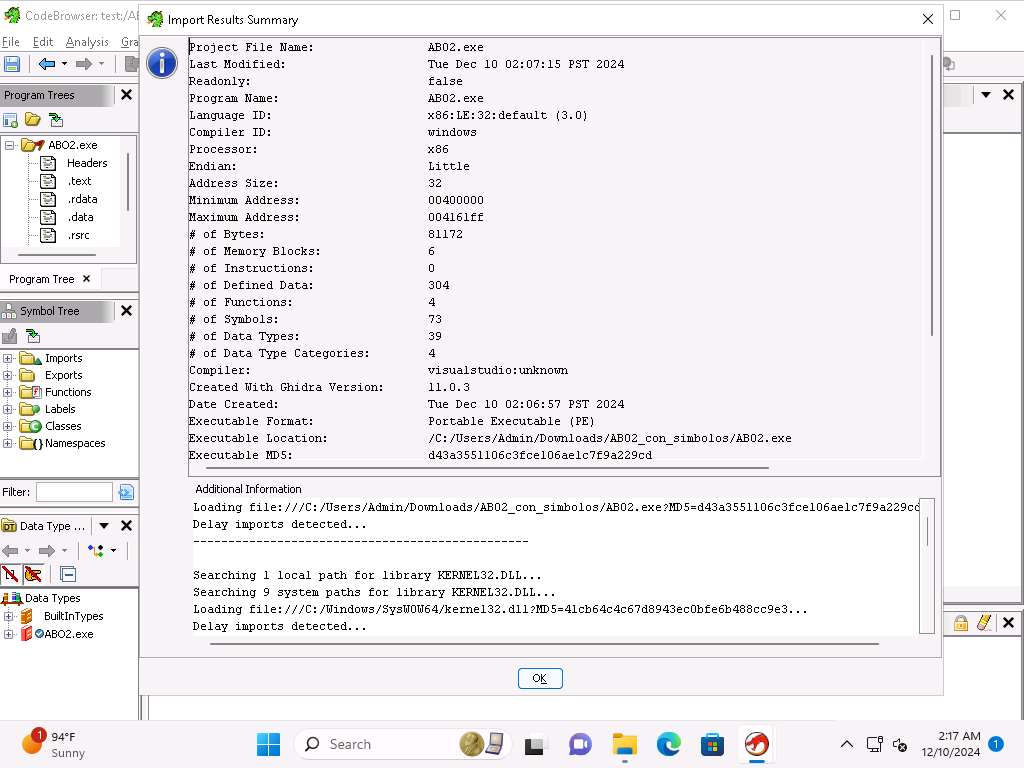
Screenshot In the Import Results Summary window, click OK.
If you are unable to view OK button then resize the Import Results Summary window.
Screenshot Now, click on Window --> Functions from the menu bar.
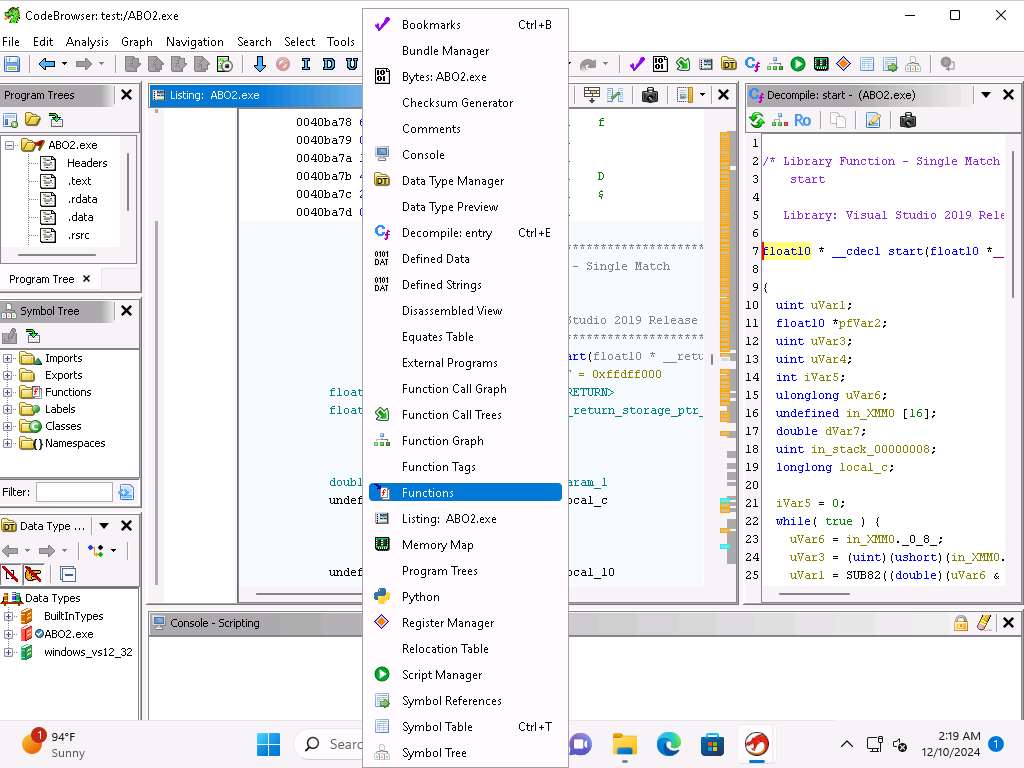
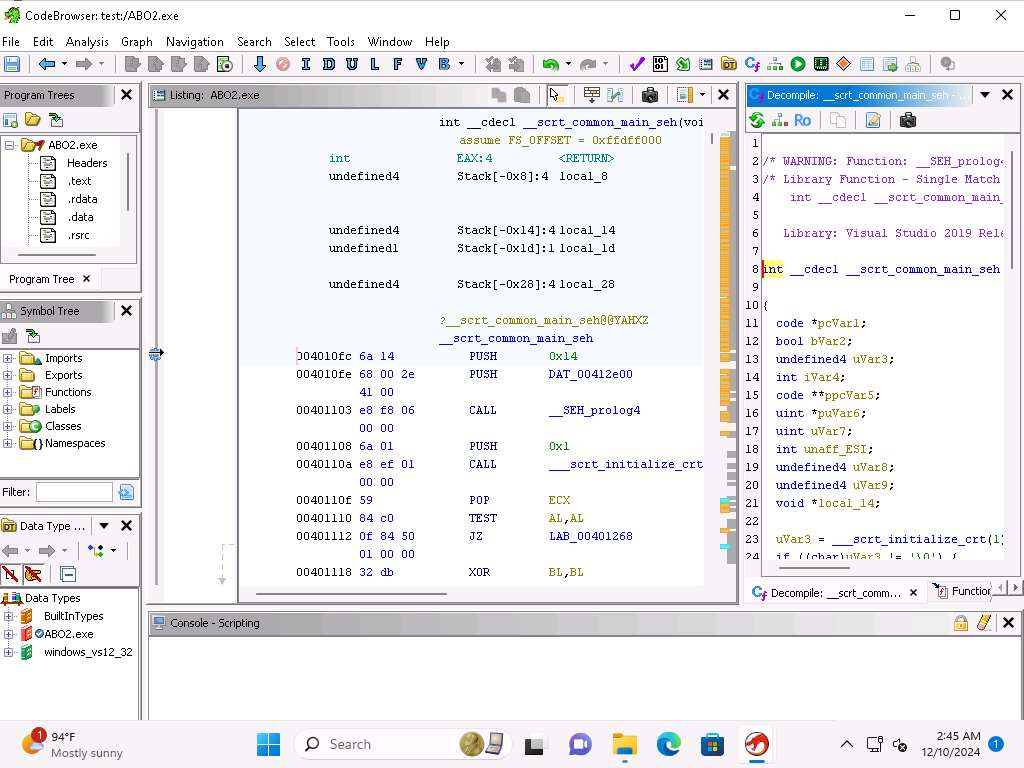
Screenshot Functions pane will be displayed at the right hand pane, double-click _scrt_common_main_seh in the Functions pane.
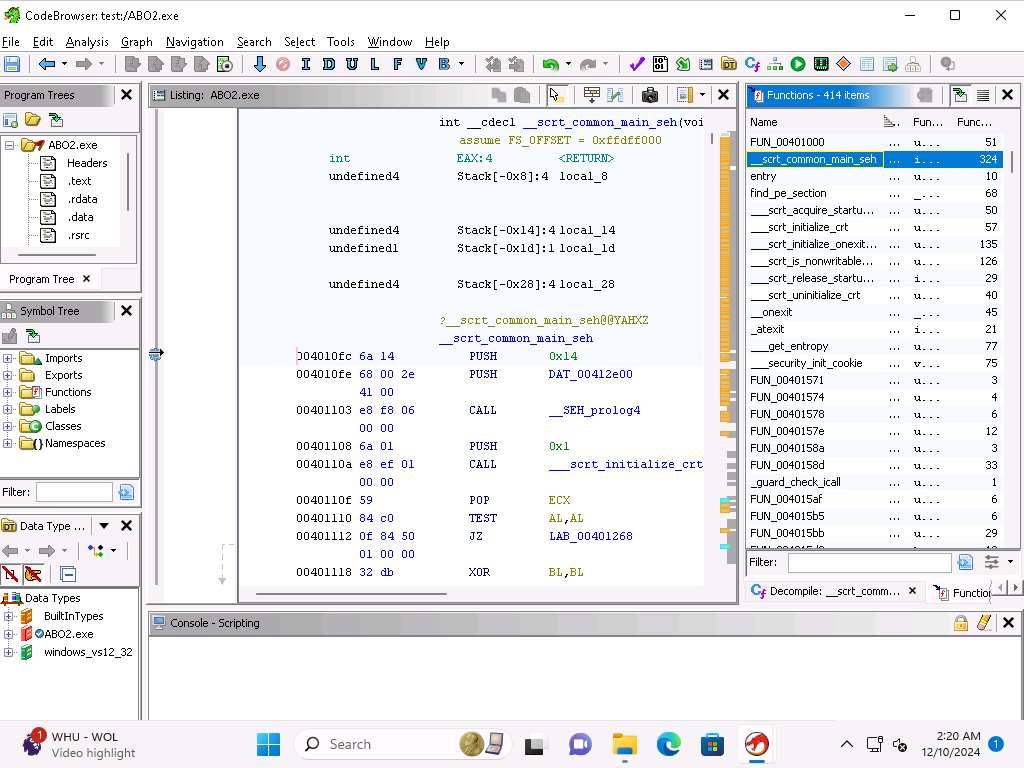
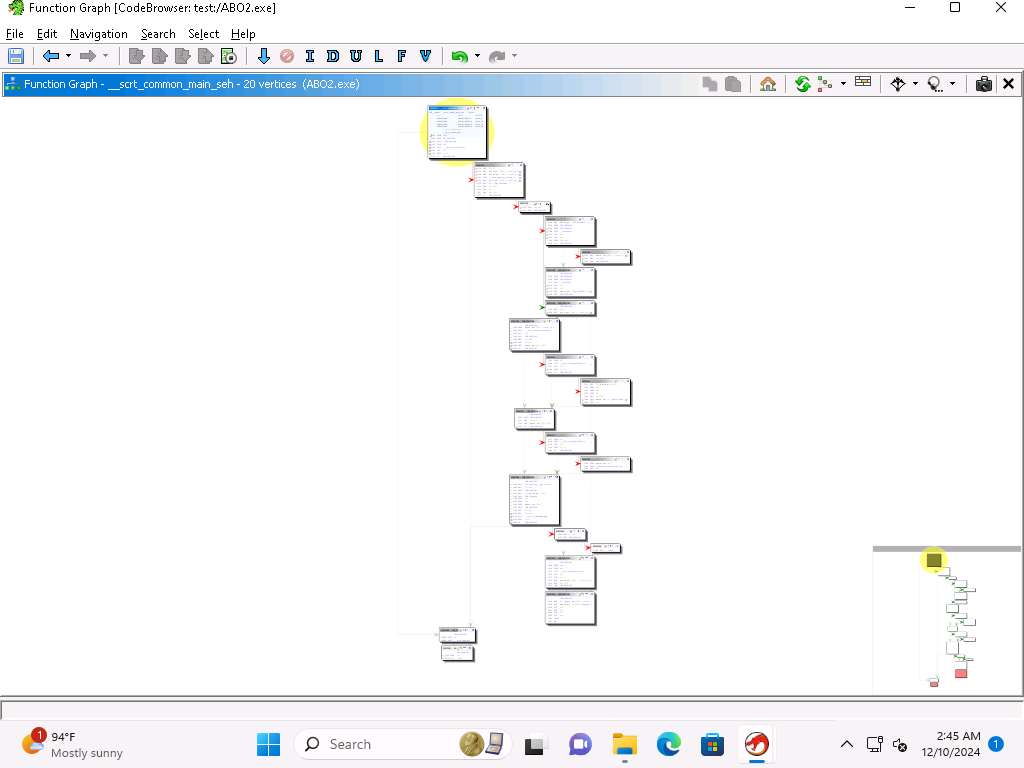
Screenshot Take a few minutes and review the code of the main function, click on Window --> Function Graph from the menu bar.
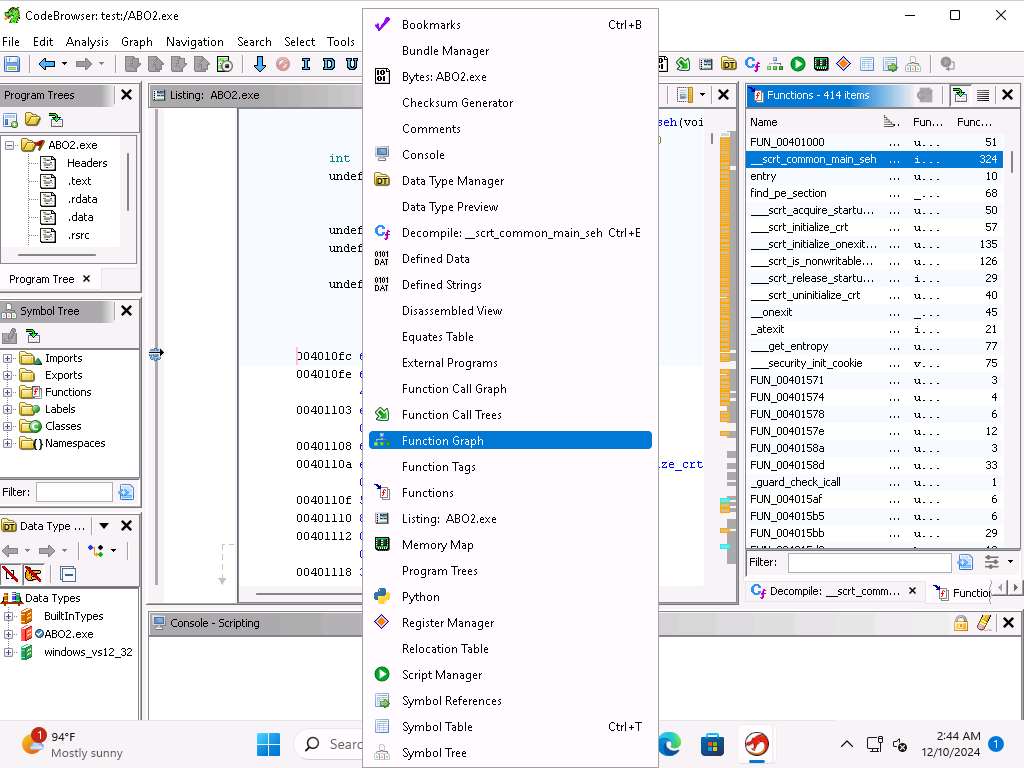
Screenshot Function Graph window appears, showing the graph of the selected function.
Screenshot Now, press CTRL+e to decompile the code.
Screenshot This has been an introduction to Ghidra, and we will end the lab here. You are encouraged to explore this code more if you want a refresher on it.
Close all open windows.
Now, we will work with another file and practice using Ghidra to Reverse Engineer it
Navigate to C:\Users\Admin\Downloads\Tools\Ghidra and double-click the Ghidarun.bat file to run Ghidra again.
If a Tip of the Day pop-up appears, click Close.
In the Ghidra window, click File --> Configure from the main menu.
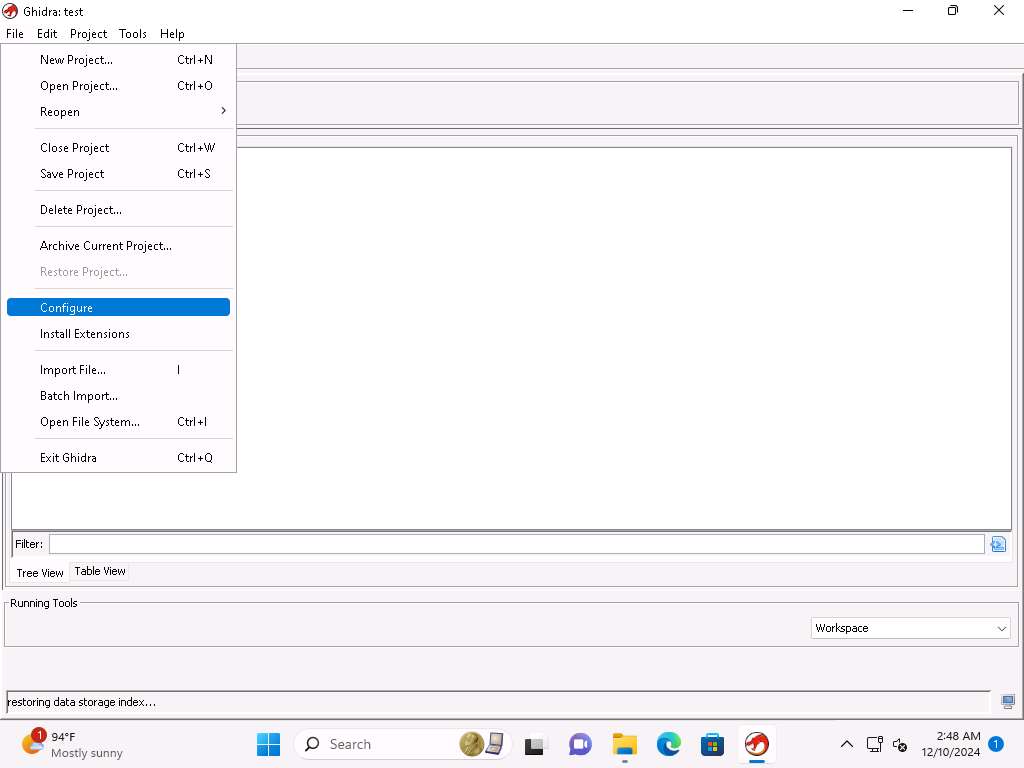
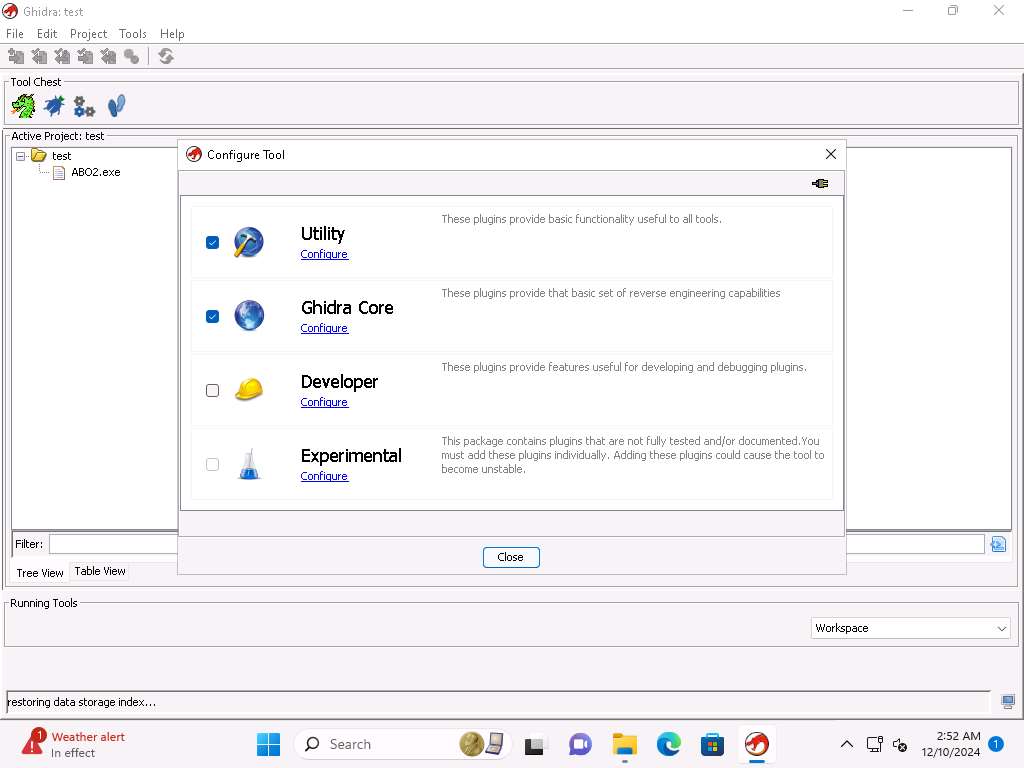
Screenshot In the Configure Tool window, ensure that the Ghidra Core checkbox is selected, we will use this plugin for reverse engineering process.
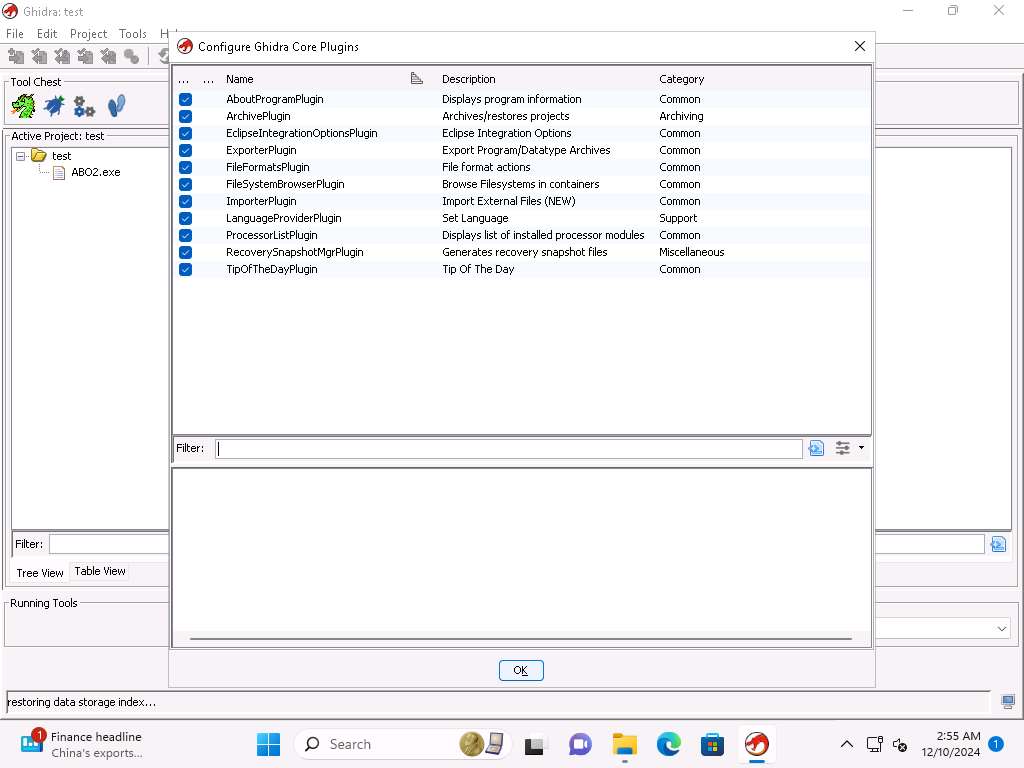
Screenshot Now click on Configure under Ghidra Core to review the list of the plugins that are present.

Screenshot Take few minutes and review the plugins and the categories then click OK in the Configure Ghidra Core Plugins window. Click Close in the Configure Tool window.
Screenshot In the Ghidra window, press F1 to open Ghidra Project Window, take a few minutes and review the information about Creating a Project and the other items in the help menu.
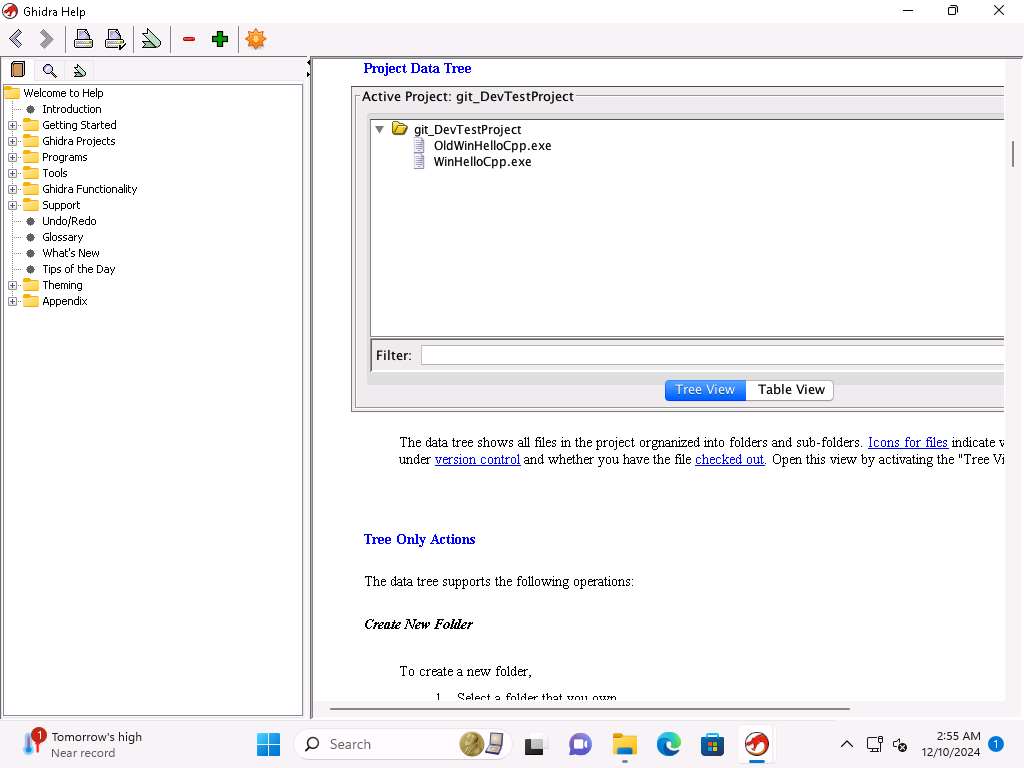
Screenshot Close the Ghidra Project Window.
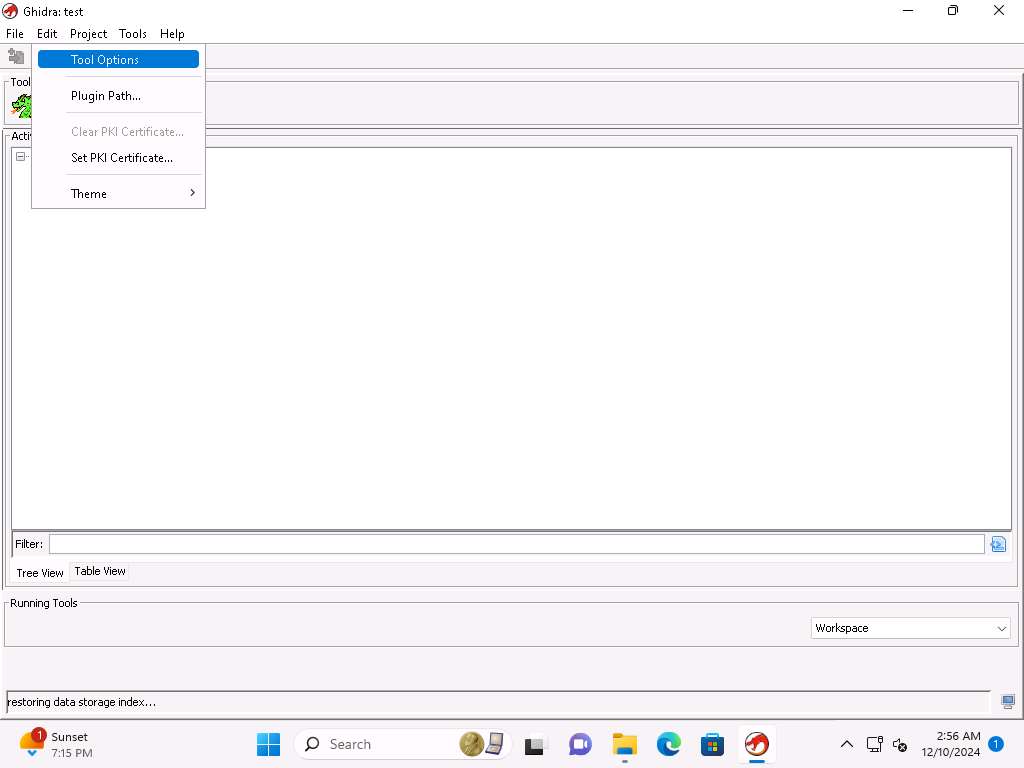
Now click on Edit --> Tool Options, in the Options for Ghidra window click on Key Bindings under Options and close the window after reviewing the key bindings.
Screenshot 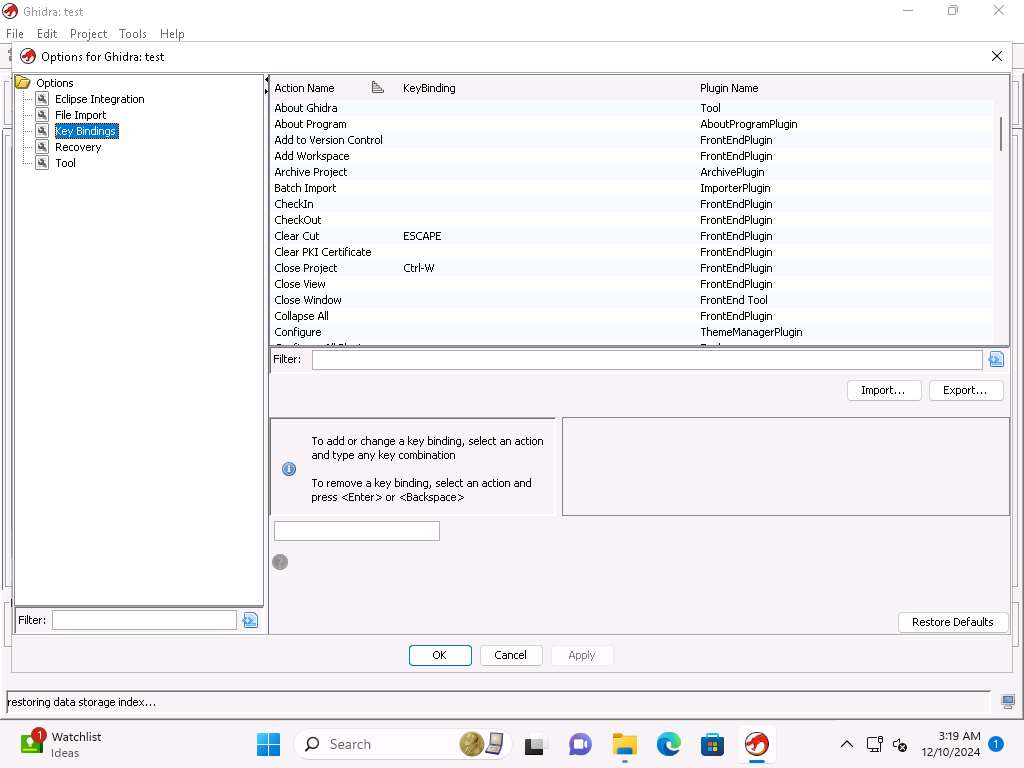
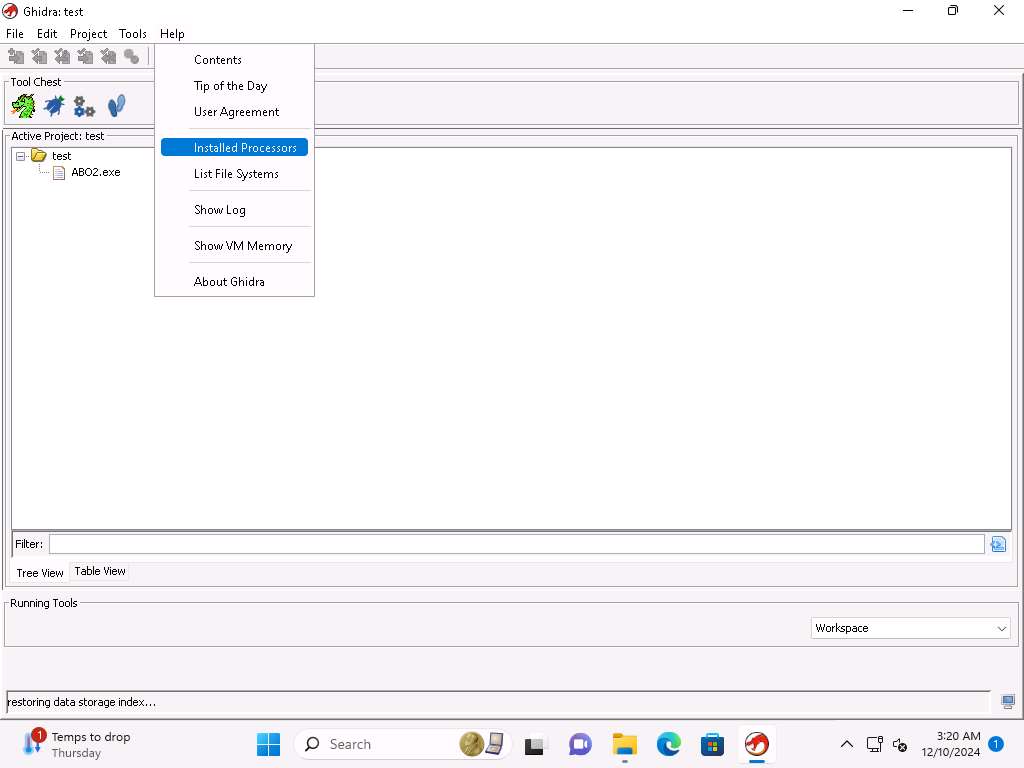
Screenshot Next, we will to take a look at the Processors, click on Help --> Installed Processors.
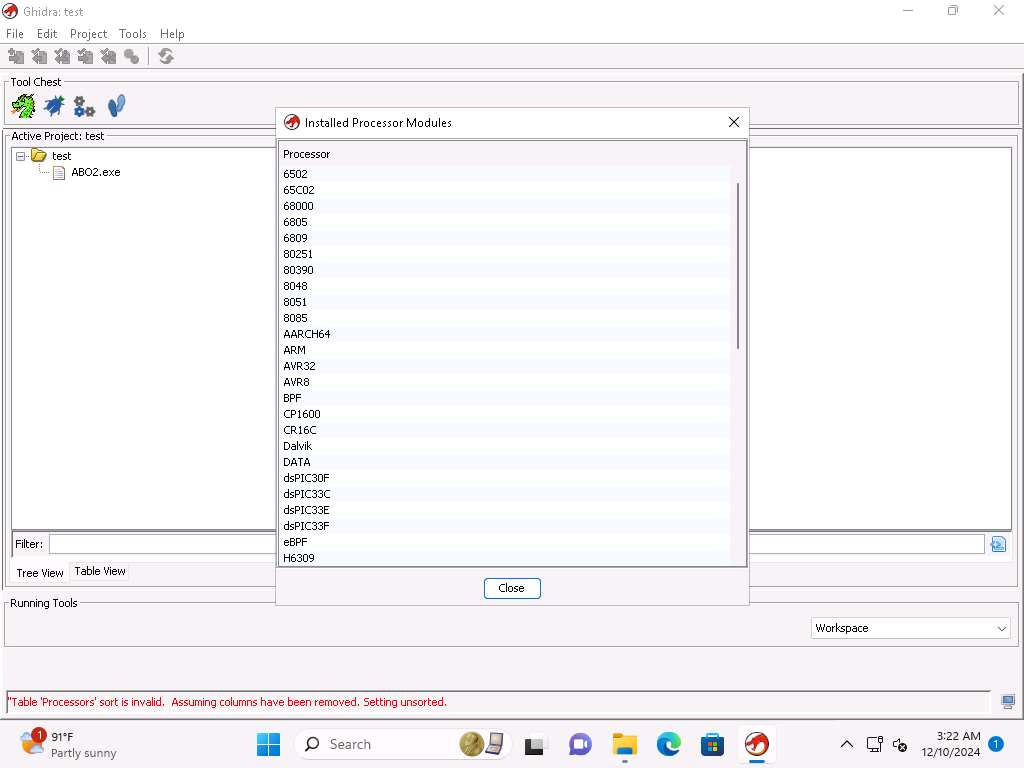
Screenshot Installed Processor modules window apears, we have a lot of different Processors that the tool supports. Take a few minutes and review the different types. Notice the ARM and other types. Close the window.
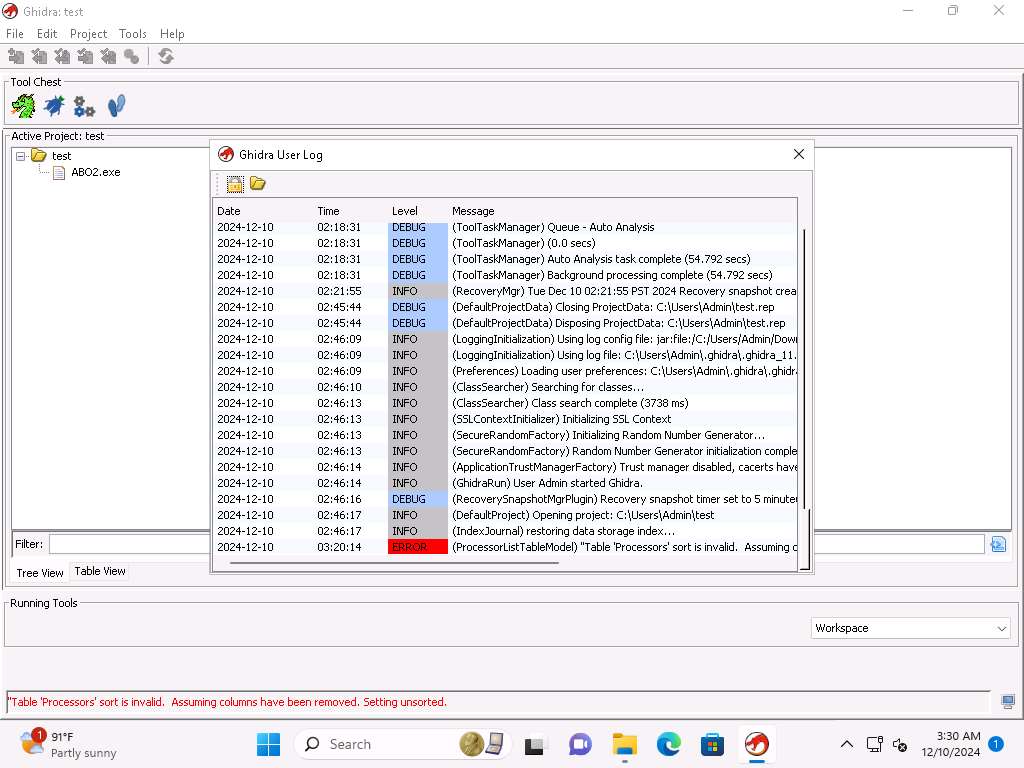
Screenshot Click on Help --> Show Log to view the logs files of Ghidra all consolidated in one place, take a few minutes and review the data that is located here.
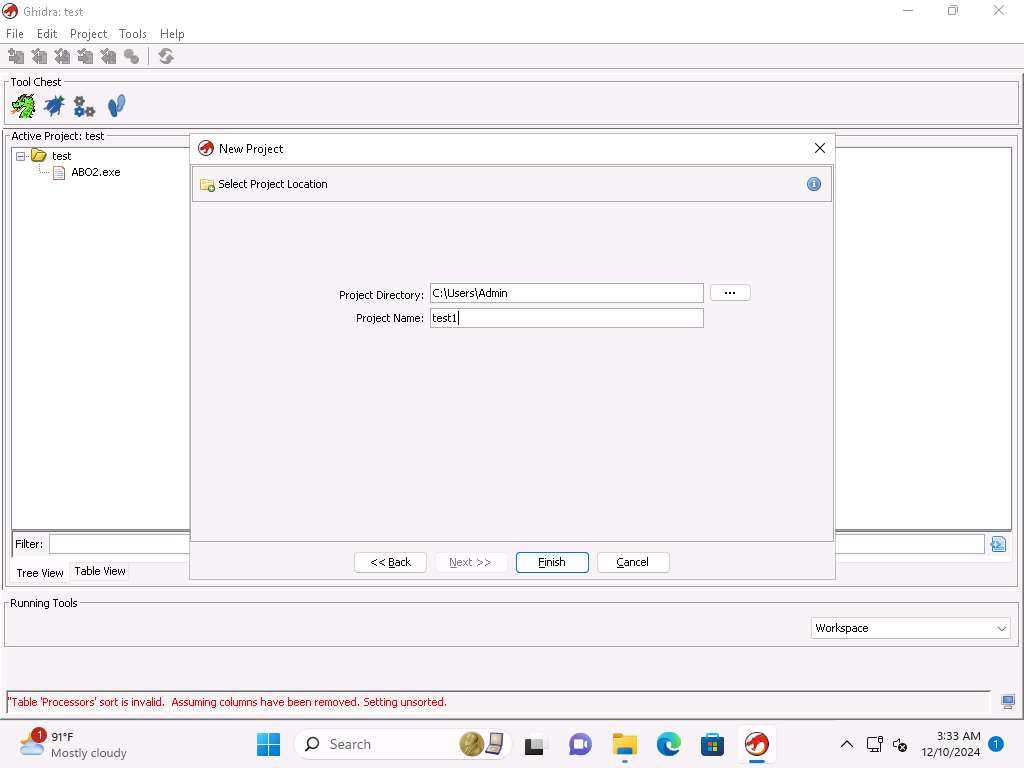
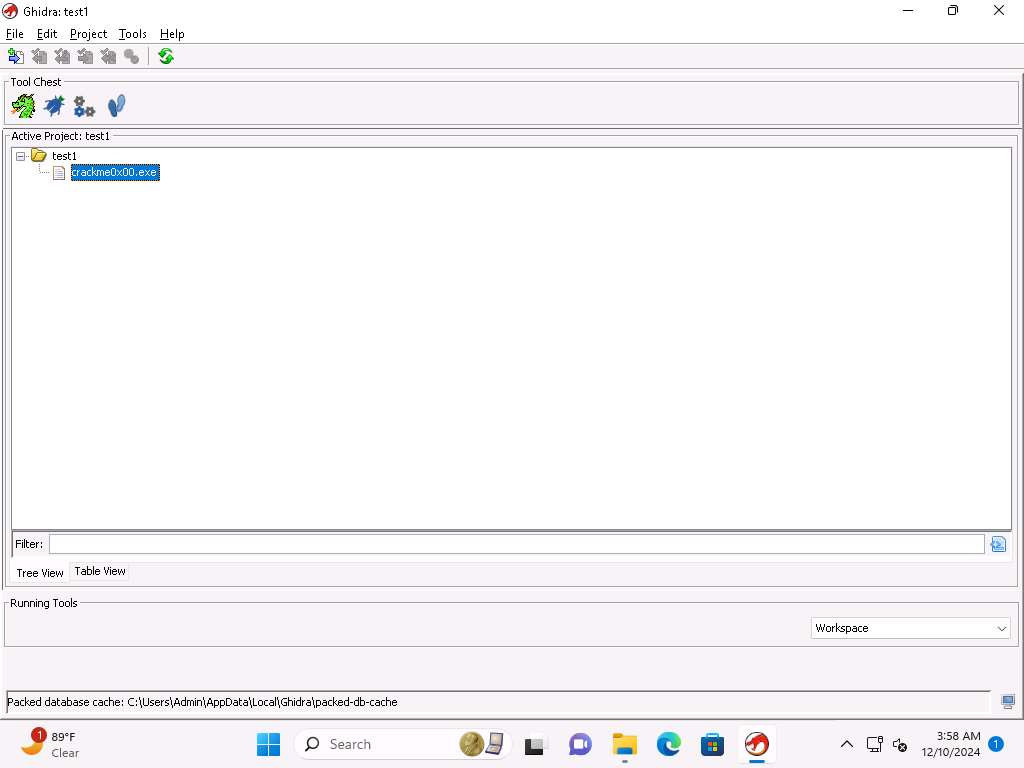
Screenshot Click on File-> New Project. Accept the default of non-shared project and click on Next, enter a name of your choice, here in the exercise we will enter test1.
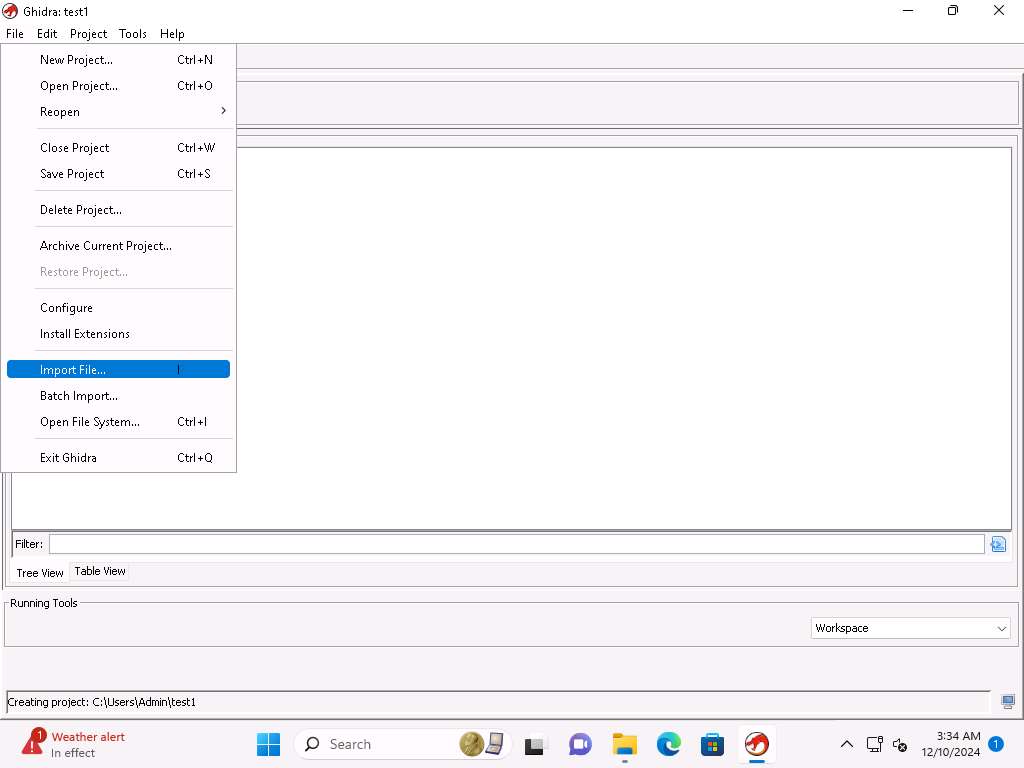
Screenshot Click on File --> Import File and select to the Crackme0x00.exe located at C:\Users\Admin\Downloads location and click on Select File to Import.
Screenshot 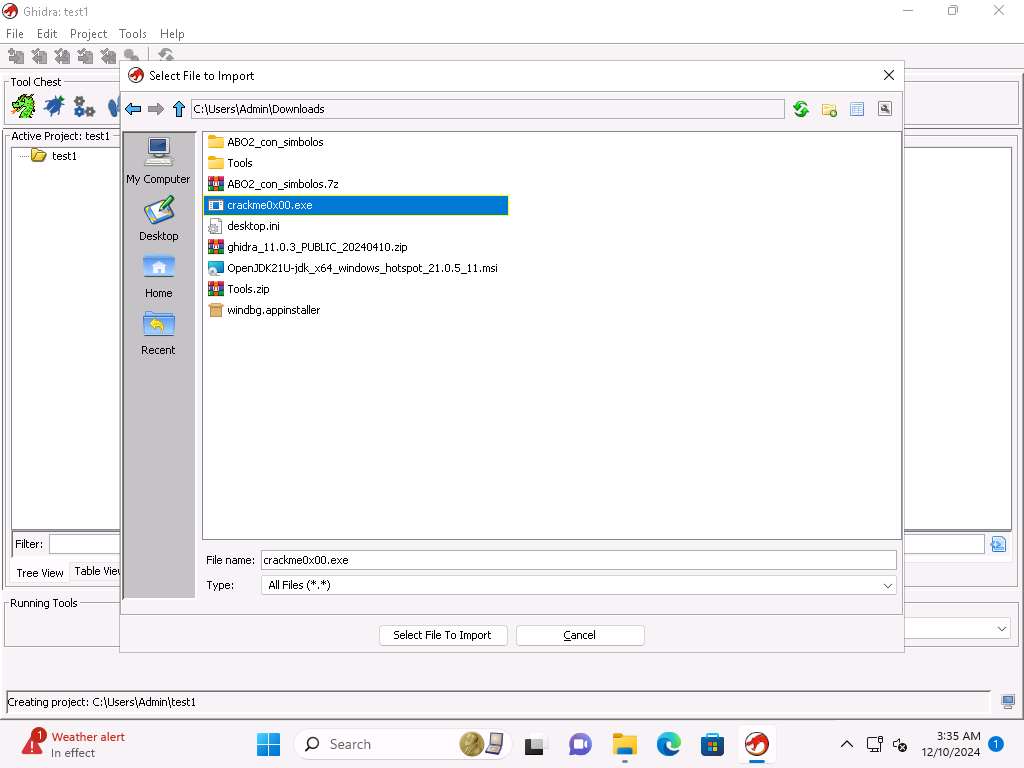
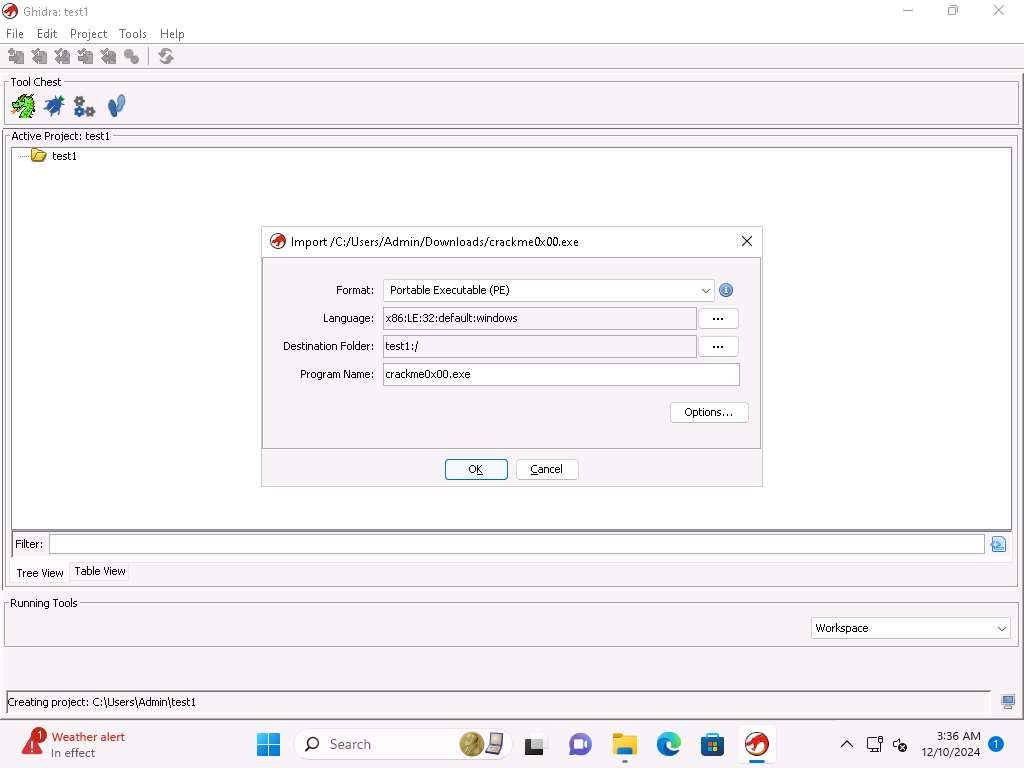
Screenshot Review the information that we have a Portable Executable format file and explore the other sections then click OK.
Screenshot It will take some time to process the file and review the information once the processing of the file has completed.
If a Windows Security Alert pop-up appears, click Allow Access.
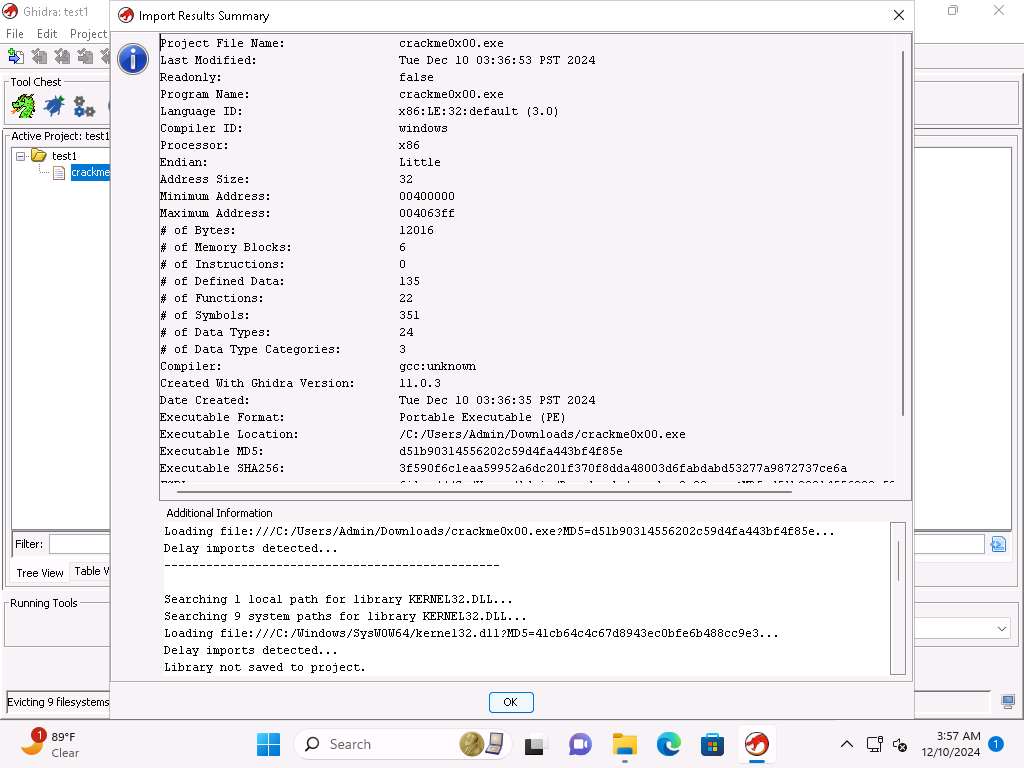
Screenshot In the Import Results Summary window, click OK.
If you are unable to view OK button then resize the Import Results Summary window.
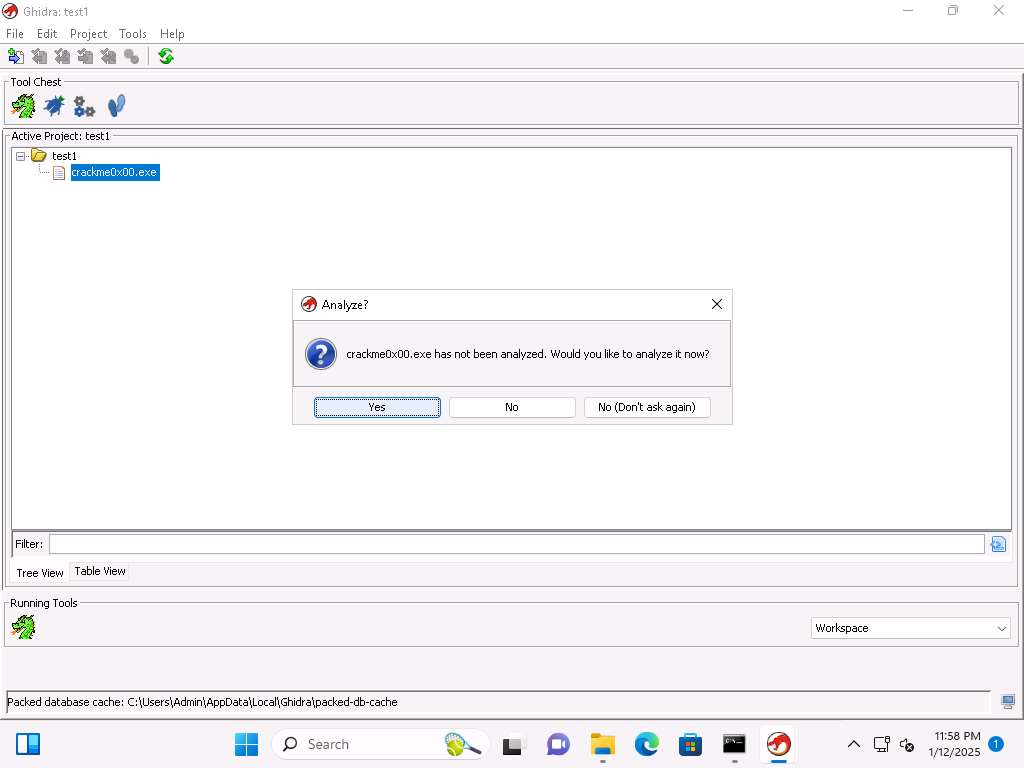
Next, double-click on the executable file, then click Yes and in the next window click Analyze to analyze the executable.
Screenshot 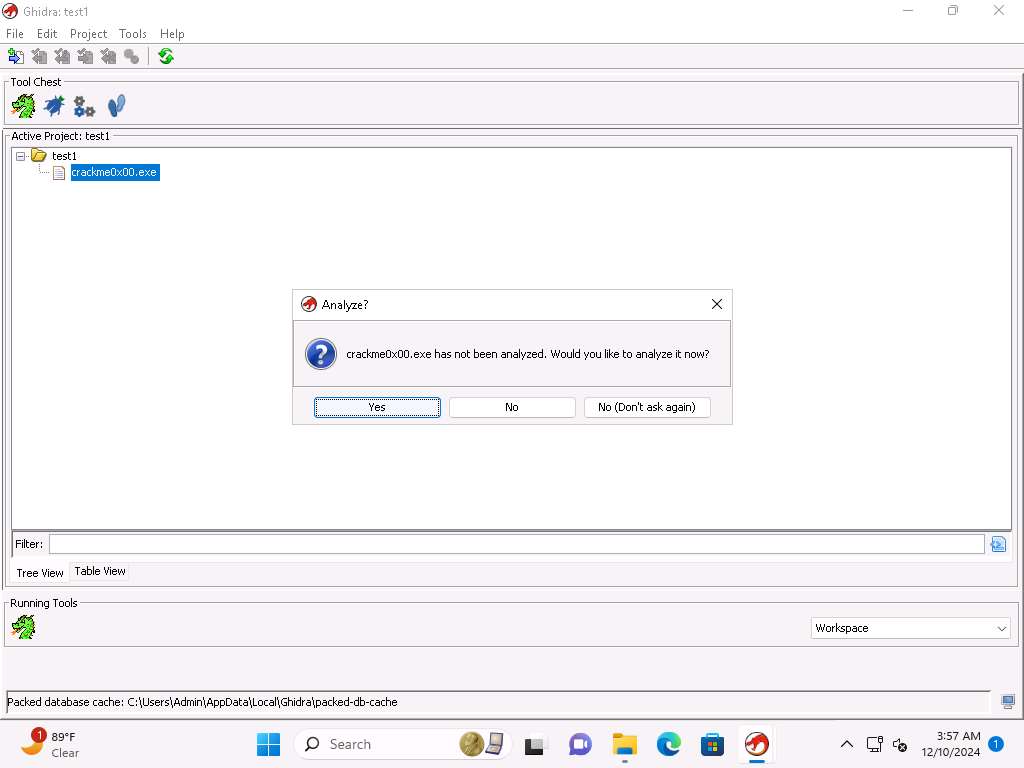
Screenshot 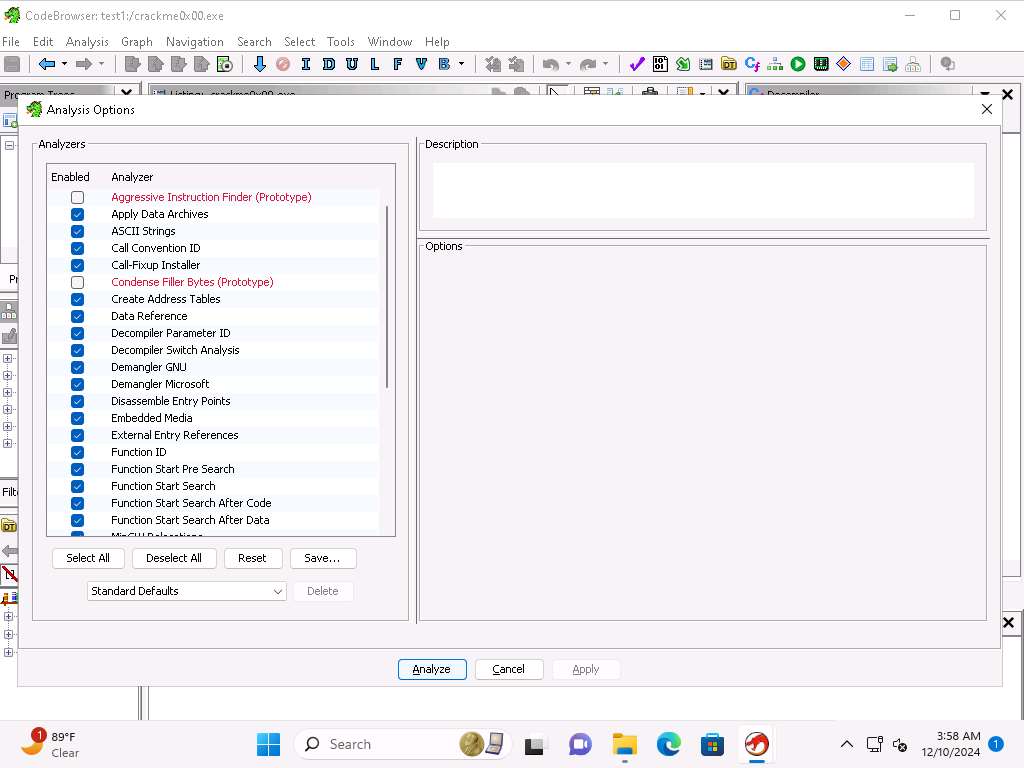
Screenshot Once the analysis finishes, explore the results.
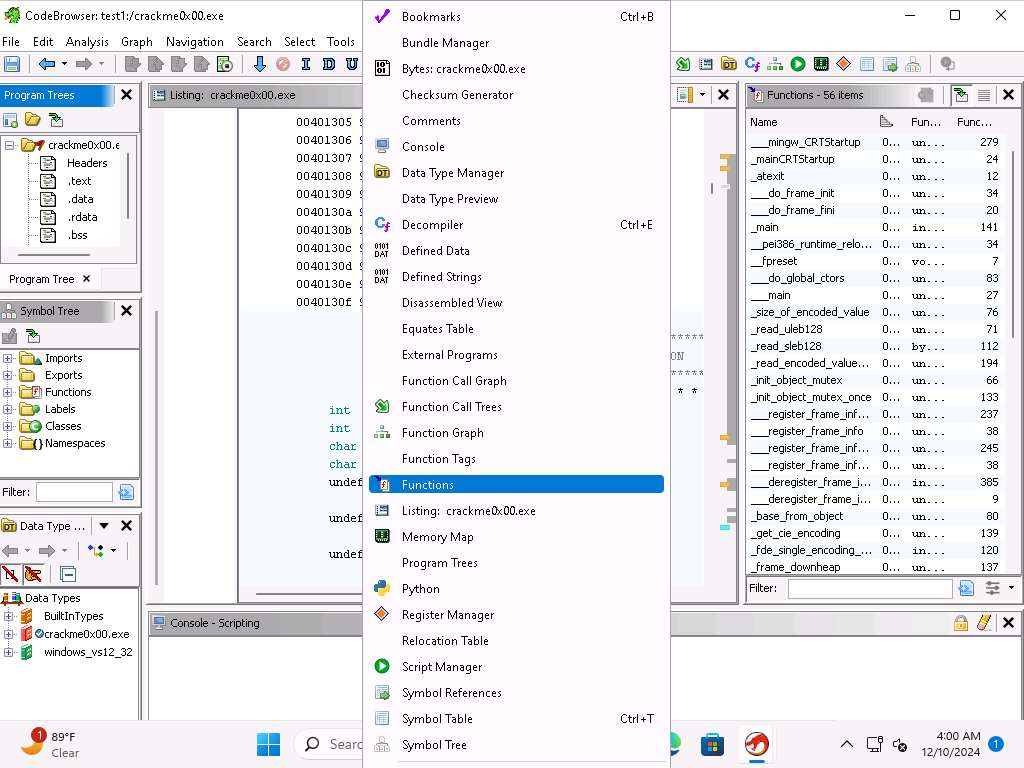
Now, click on Window --> Functions from the menu bar to view thw Functions that are imported by binary.
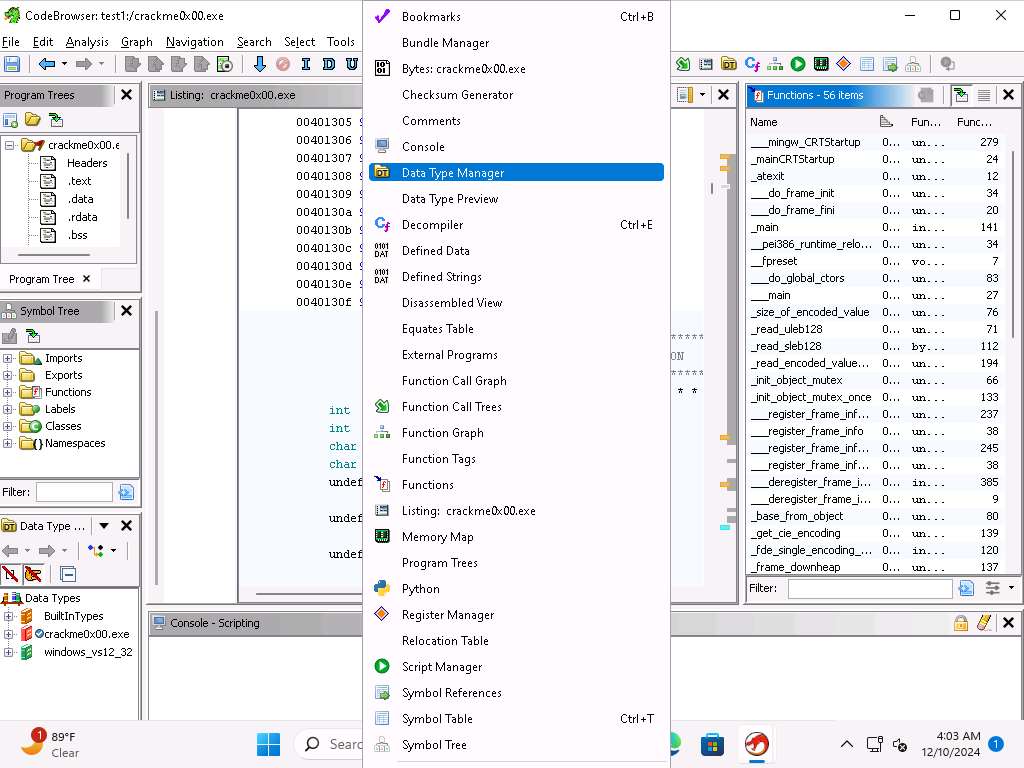
Screenshot Now, click on Window --> Data Type Manager, Data Type Manager window opens at the bottom left, drag the window to open it in a new window to view all bulding datatypes.
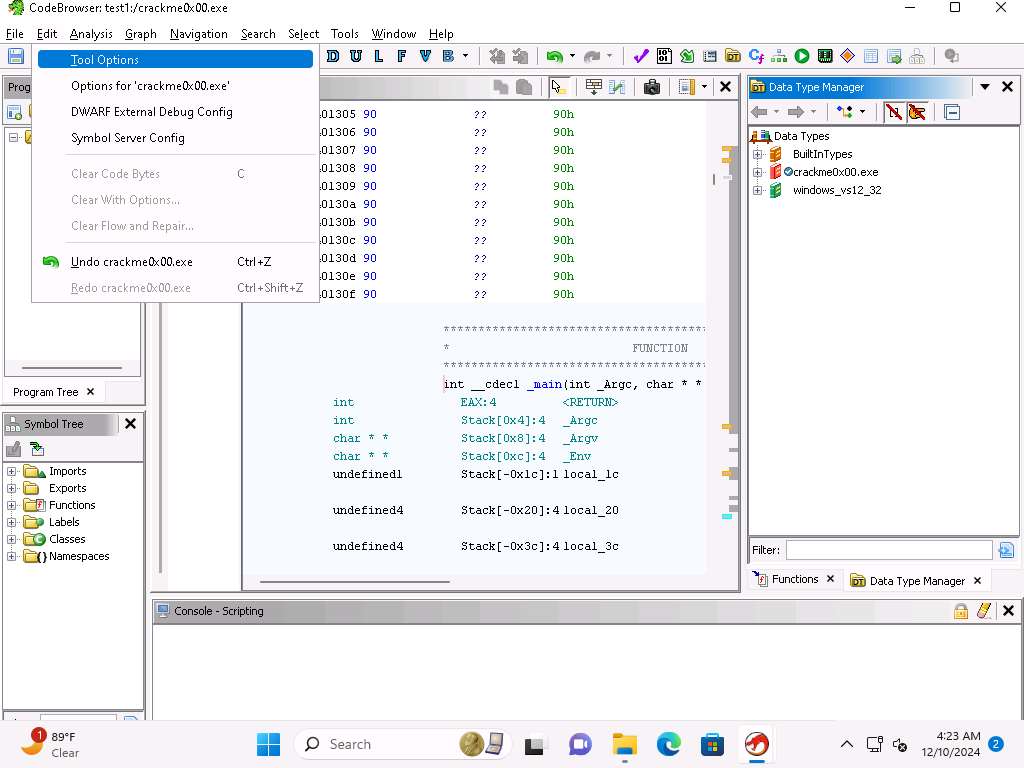
Screenshot Now, we will view all the tools that are available, to do so click Edit --> Tool Options.
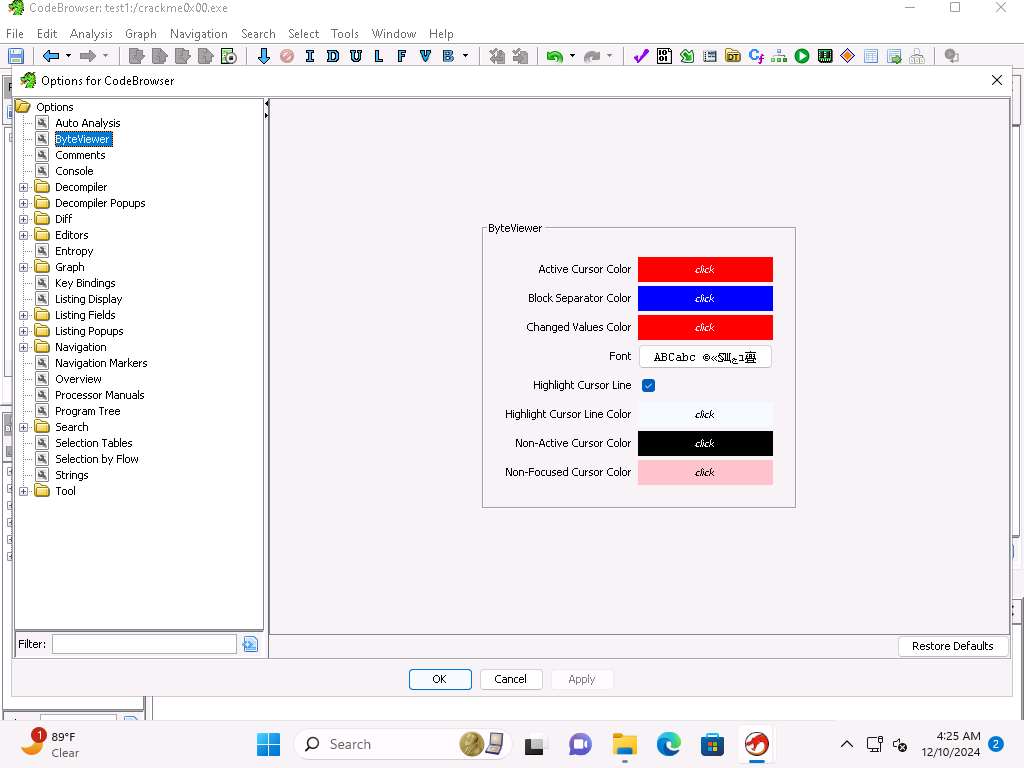
Screenshot Take a few minutes and explore the different tool option, as an example, you can click ByteViewer and review the different colors for the interface. Close the Options for CodeBrowser window.
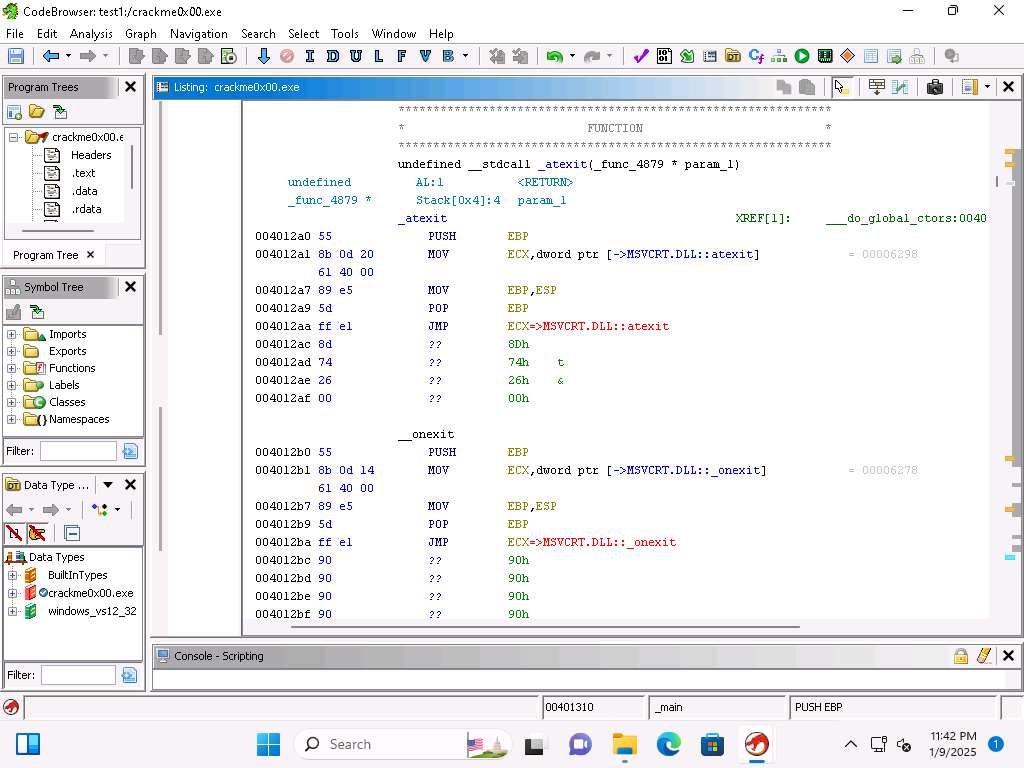
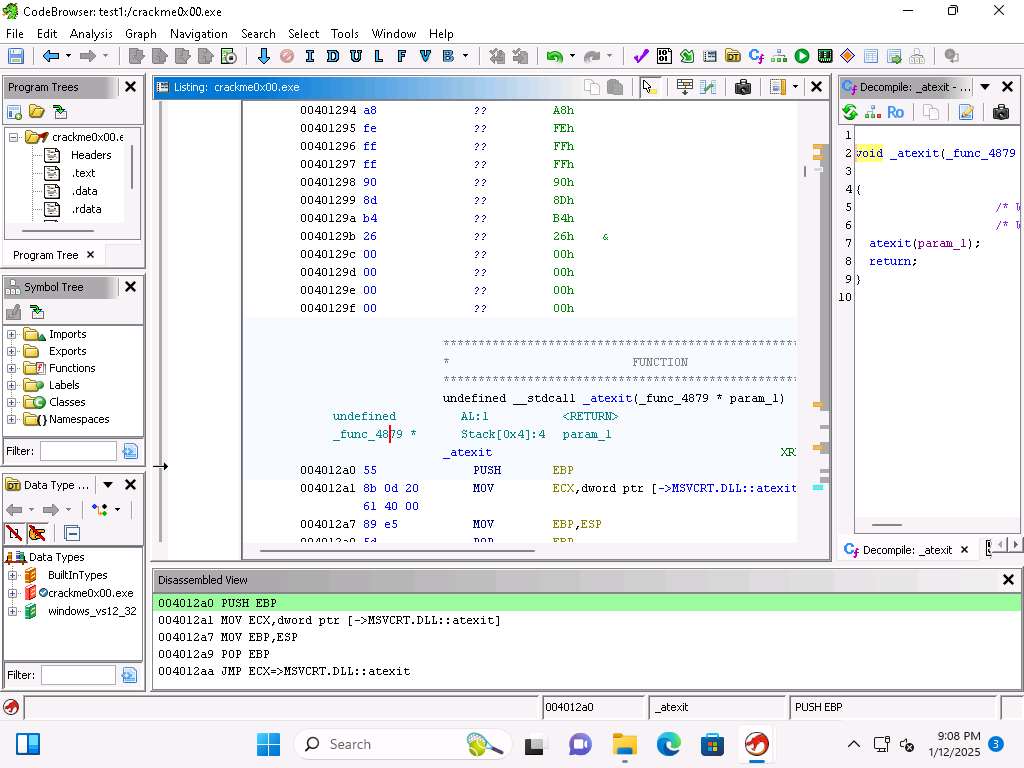
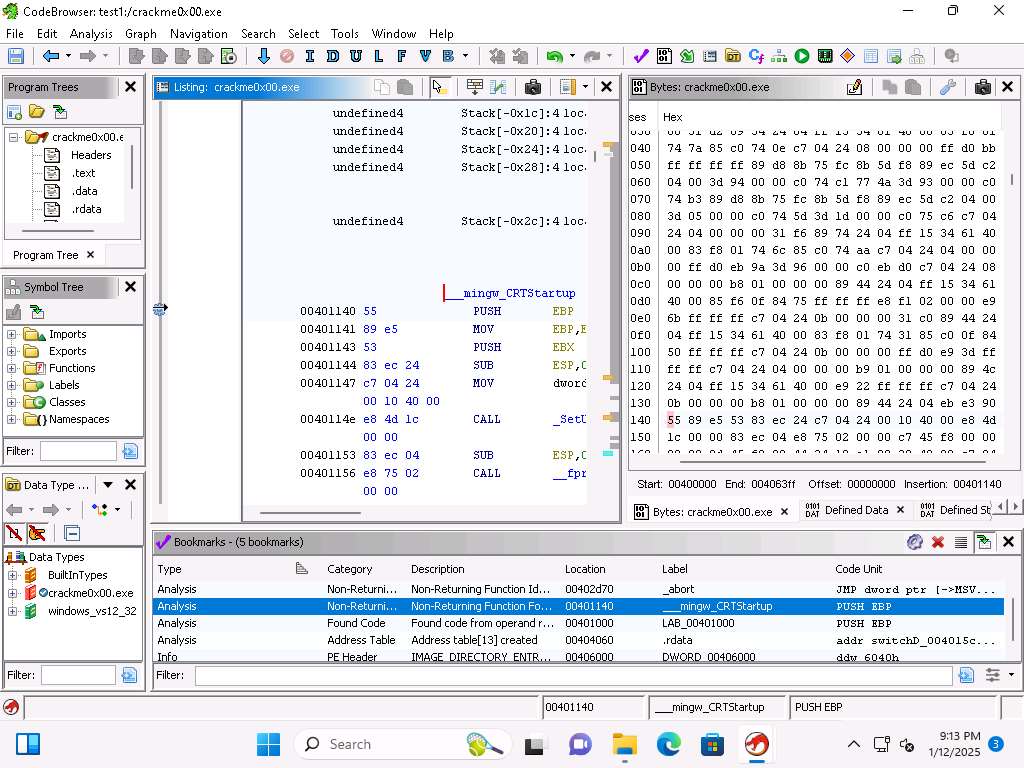
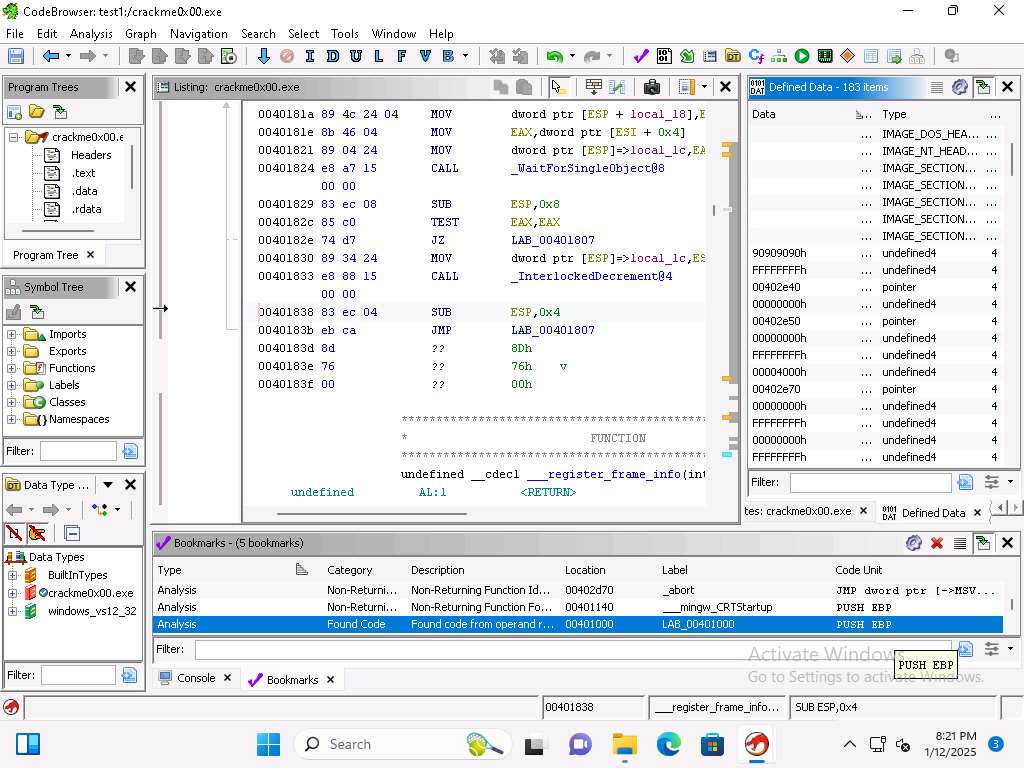
Screenshot The Listing window, shows the decompiled code of the executable.
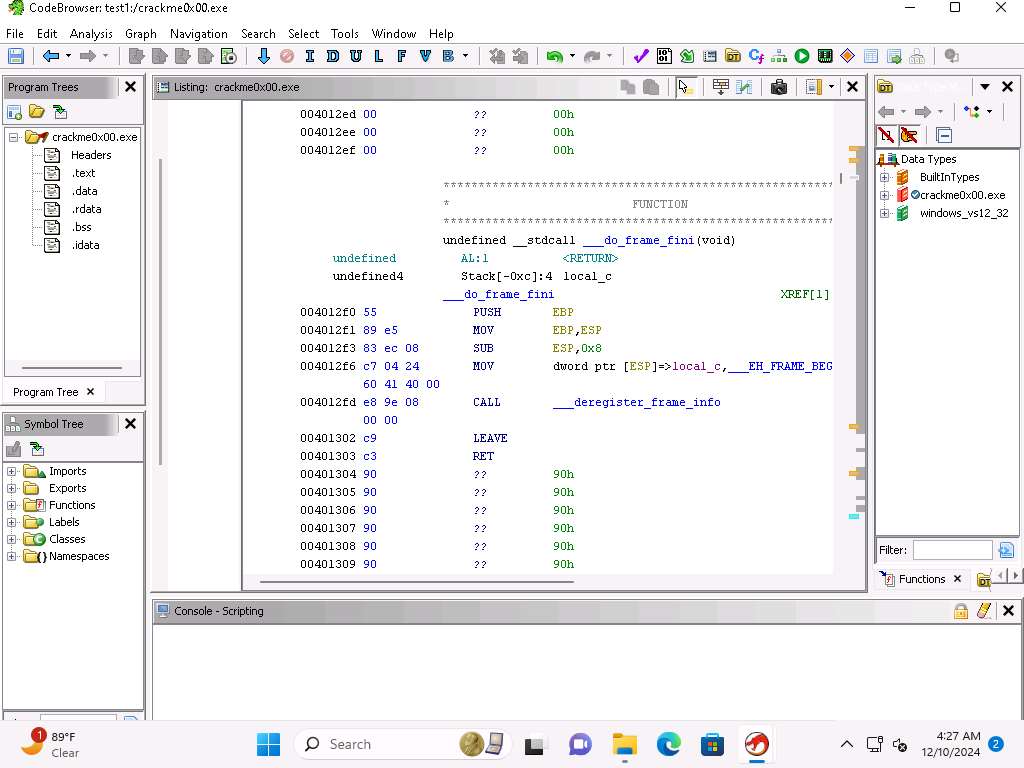
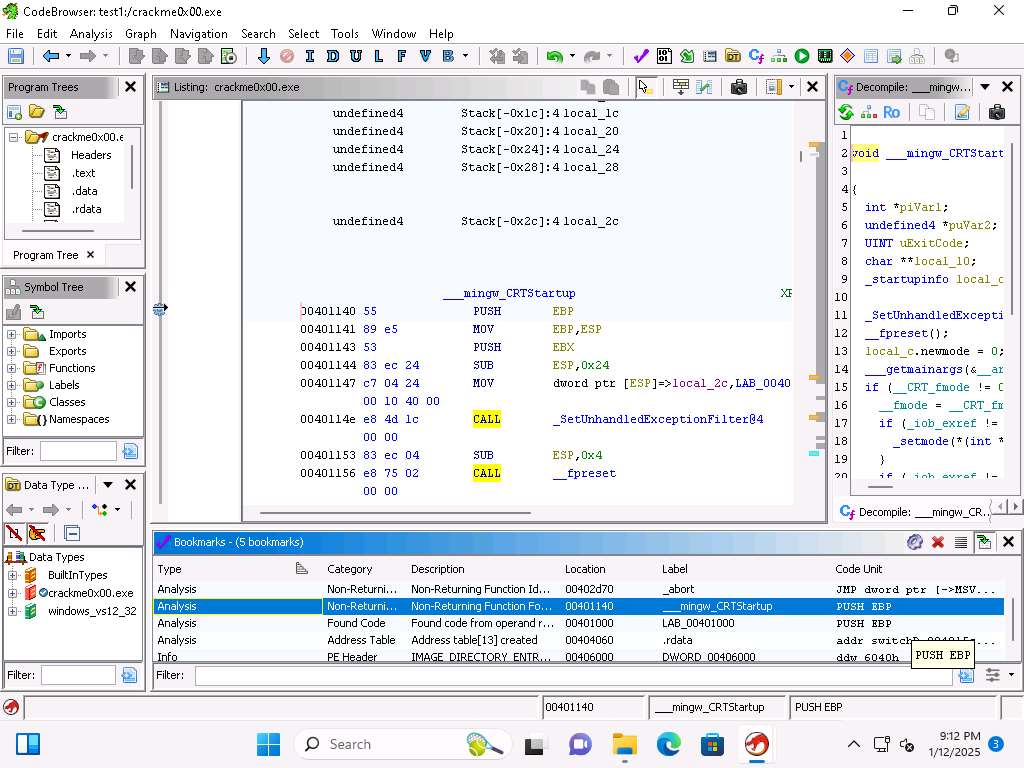
Screenshot Scroll down and see the code for the Stack, and locate the instruction for the Push EBP.
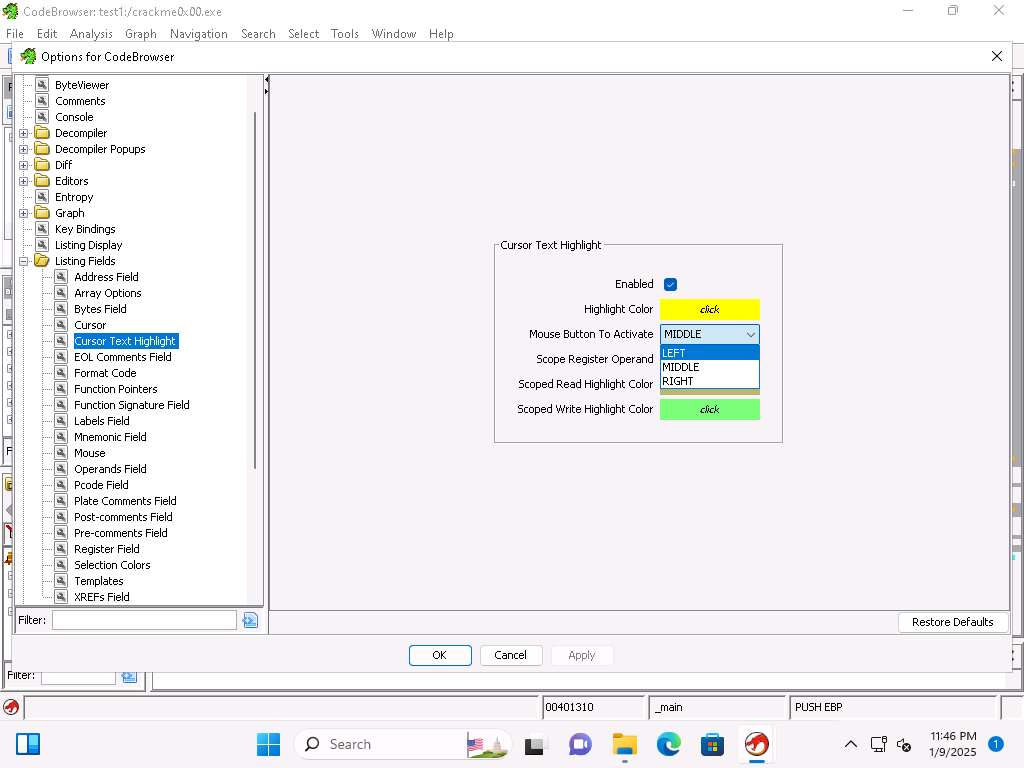
Screenshot You can change the mouse button from the default of middle to left, click Edit --> Tool options and in Options for CodeBrowser window expand Options --> Listing Fields and click Cursor TextHighlight.
Make a selection and click on Apply and then OK.
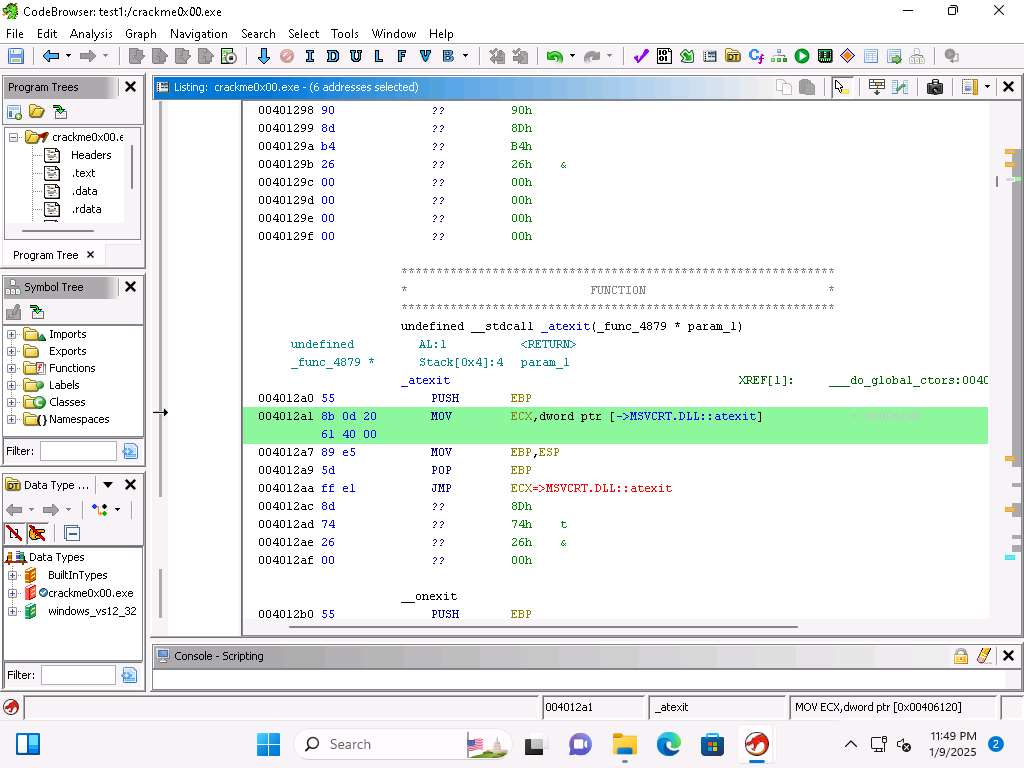
Screenshot Once you have done this then you can highlight any instruction that you want to view.
Screenshot We have the ability to decompile the code and Ghidra is very good for this and a sophisticated transformation engine.
Click anywhere in the Listing window it and this will decompile the code. An example of this is shown in the next image:
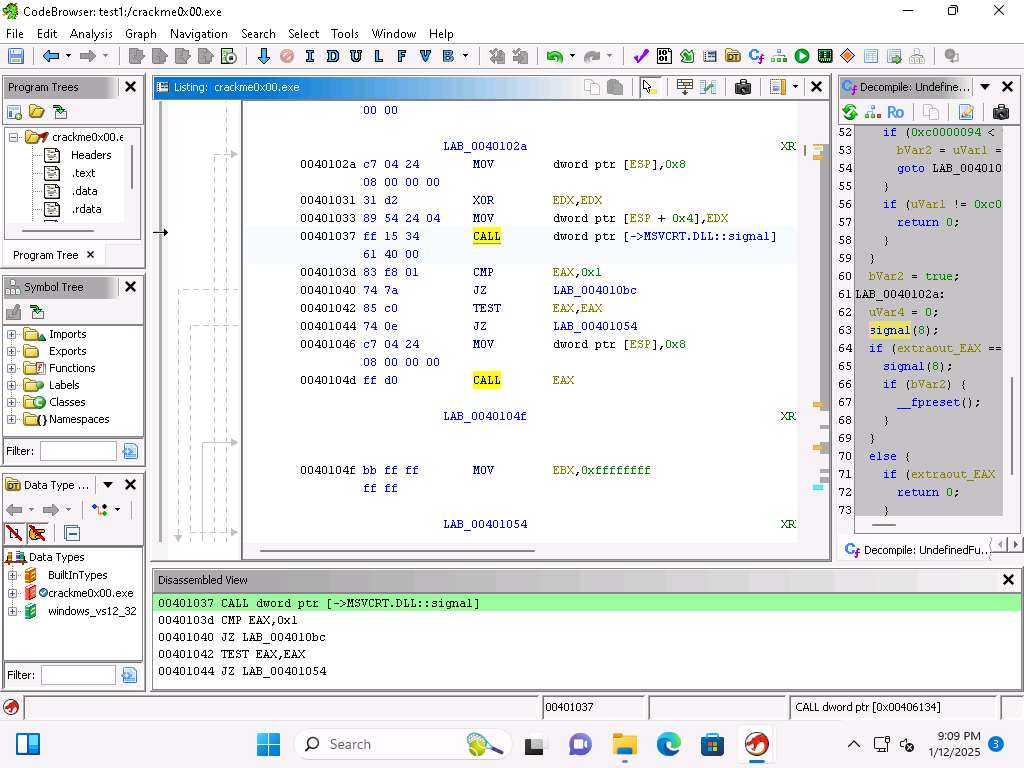
If Decompiler windows is not visible click Window --> Decompile.
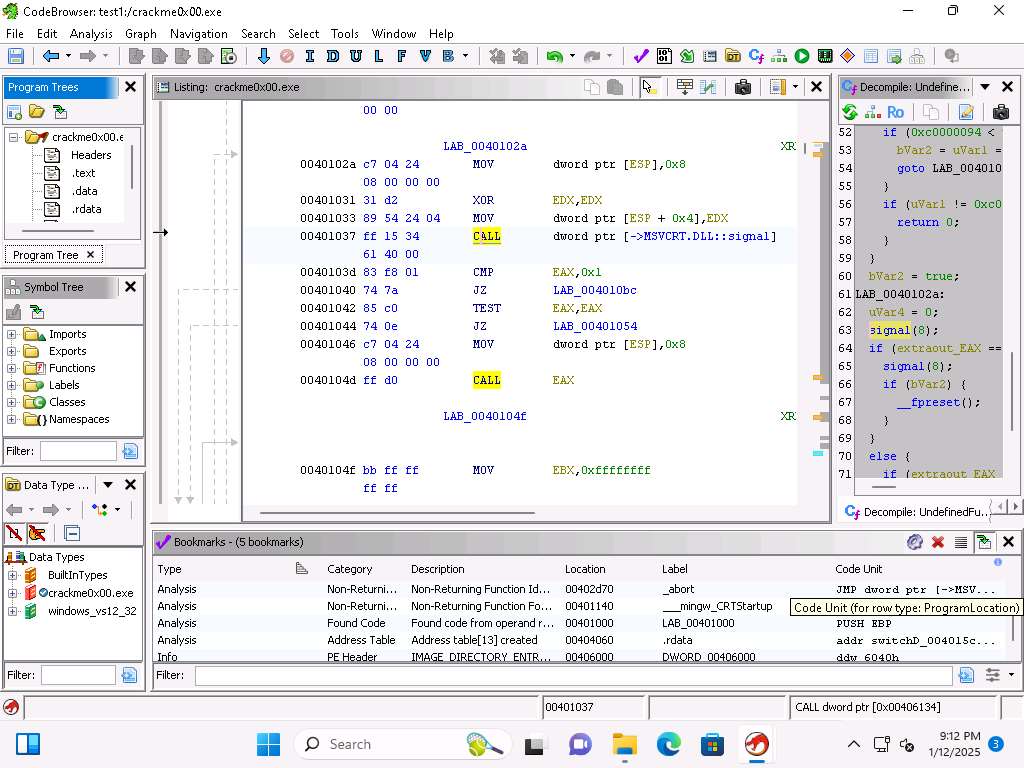
Screenshot The syntax highlighting works the same, so we can click on the statement, like the if condition and then all of them will be highlighted (here we seleted CALL). When you select a specific line the details of it will be at the bottom of the window.
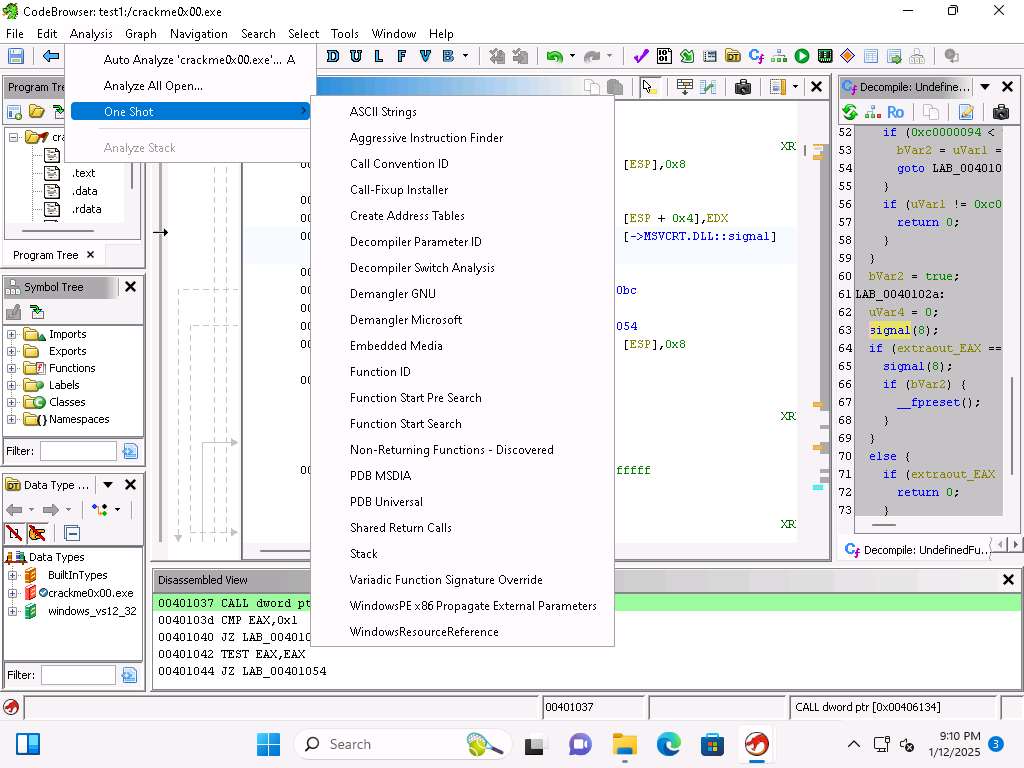
Screenshot Another item we can look at is the option for the One Shot Analysis, click Analysis --> One shot.
Screenshot Navigation option can be used to go to any address.
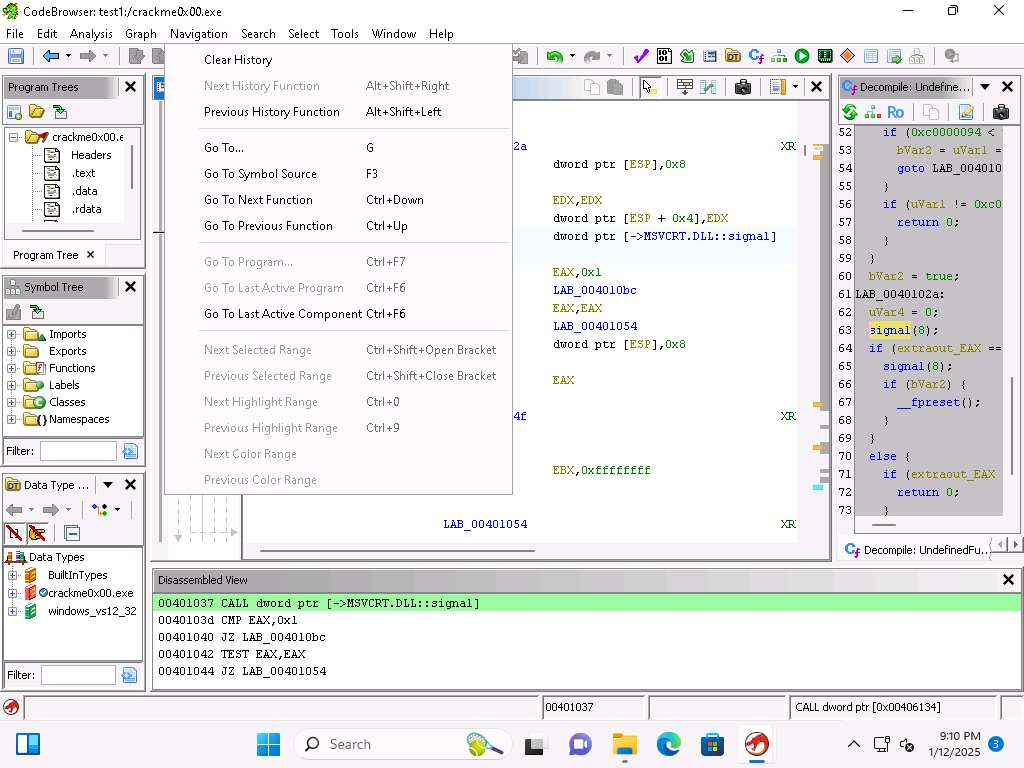
Screenshot We can also go to any expression. Take a few minutes and review the different options, as a reminder you can press F1 to get help on the items as well.
We can add offsets as well to the address and use the Navigation to move between functions
Take a few minutes and explore the options available under the Window menu. We will explore those in more detail later.
Click on Help --> Ghidra API Help, review the information here, because it allows us to extend the API.
If How do you want to open this? pop-up appers, select Microsoft Edge browser
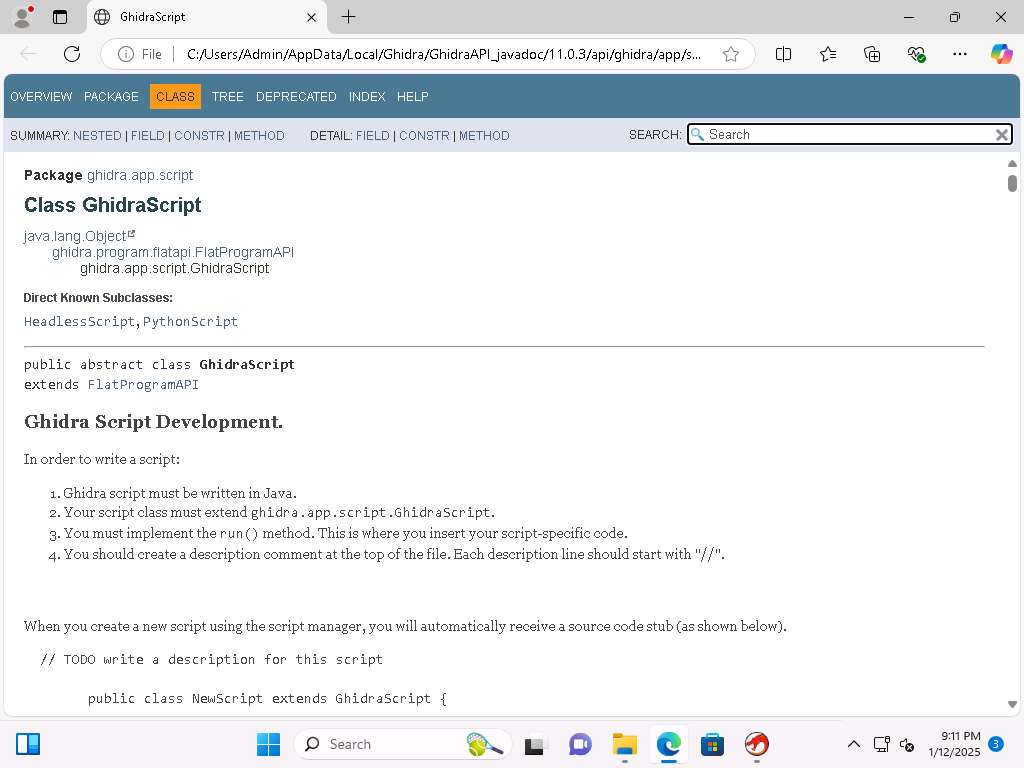
Screenshot Within Ghidra you have a lot of available scripts and integration with Jython. Close the browser window.
Now, we will look at the available Windows tools that we have in the Ghidra platform. There are quite a few plugins within Ghidra that we can leverage and use for our reverse engineering activities. We can create additional tools by combining and integrating the plugins. It is just a matter of practice.
The first tool we will explore is the Bookmark tool. You can close the decompile window since we do not need it at this time. We use Bookmarks to flag addresses in the code that we are investigating.
Screenshot As we see from the above image we have the 5 bookmarks that we can reference in the code we have been reviewing. Within these we have the Category, Description, Location, Label and Code Unit. By selecting the Bookmark it will move you to that point in the code.
Screenshot When you select a section of code, if you right-click you can set a Bookmark.
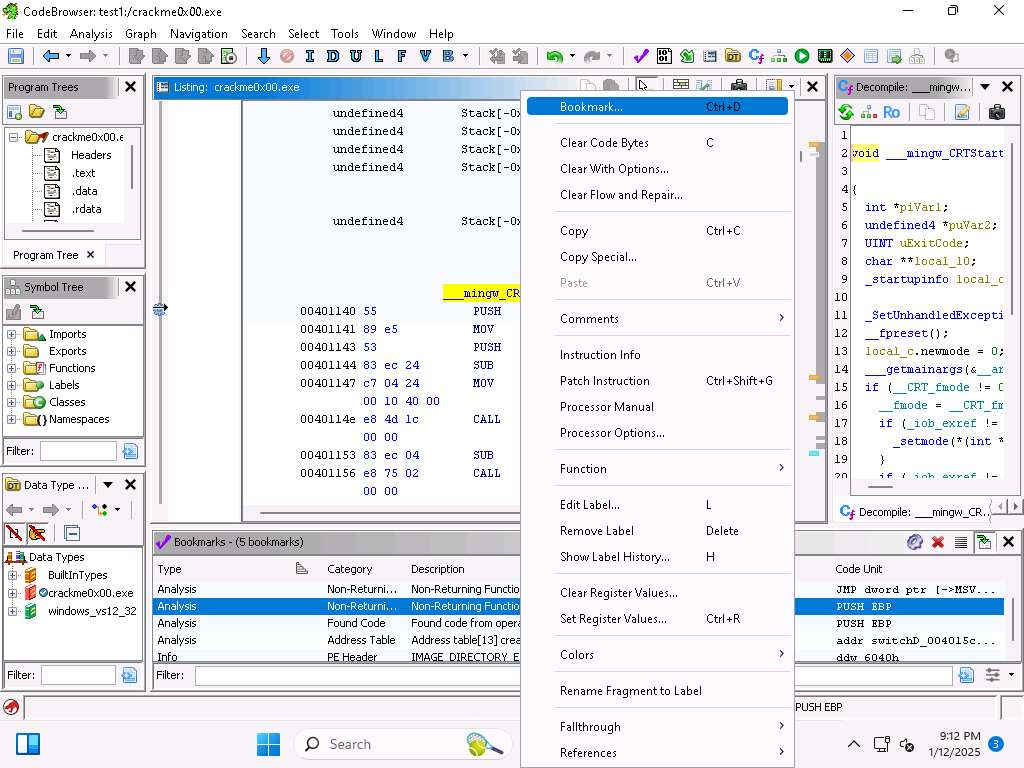
Screenshot Take a few minutes and review the different options when you right-click.
The next tool to look at is Bytes, click Window --> Bytes.
As you can see here, we have a representation of the code in Bytes and it looks just like a hex editor, we do have the option to review the code in ASCII, and Octal as well.
Screenshot You can see at the bottom of the byte window the addressing for memory.
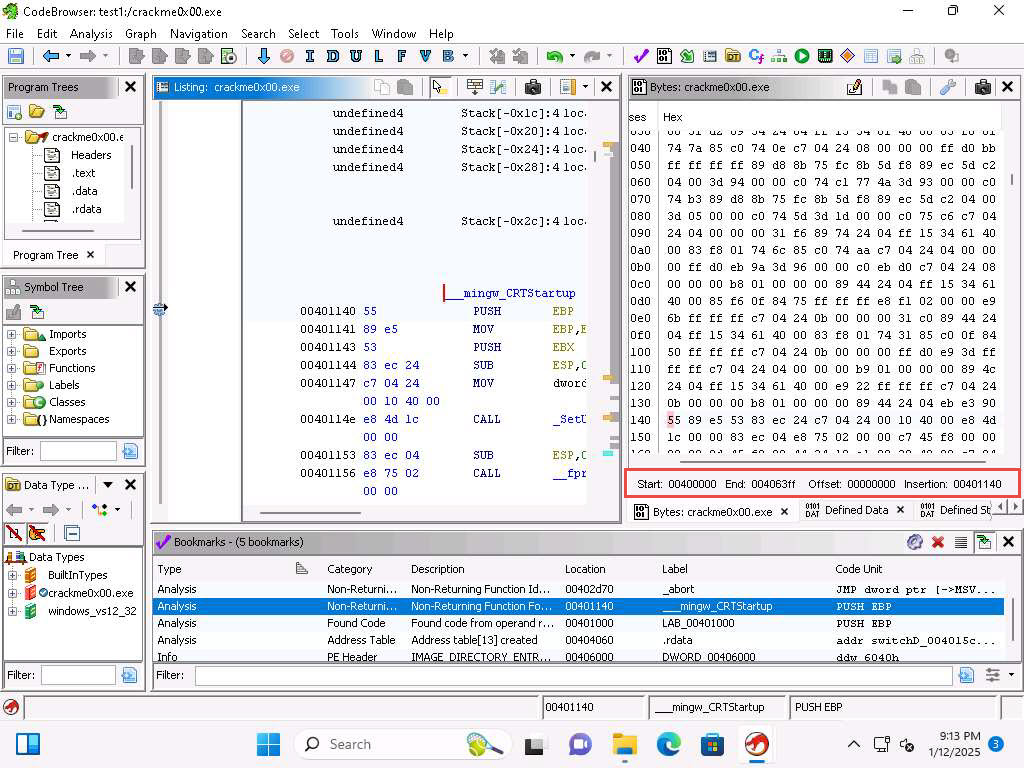
1kr2rvell.jpg The "insertion" item is the address of the cursor at the current position
We also have the capability to edit instructions, you can click on the Edit the Listing fields icon that is located in the Listing window. Click the icon again to return back to Listing window.
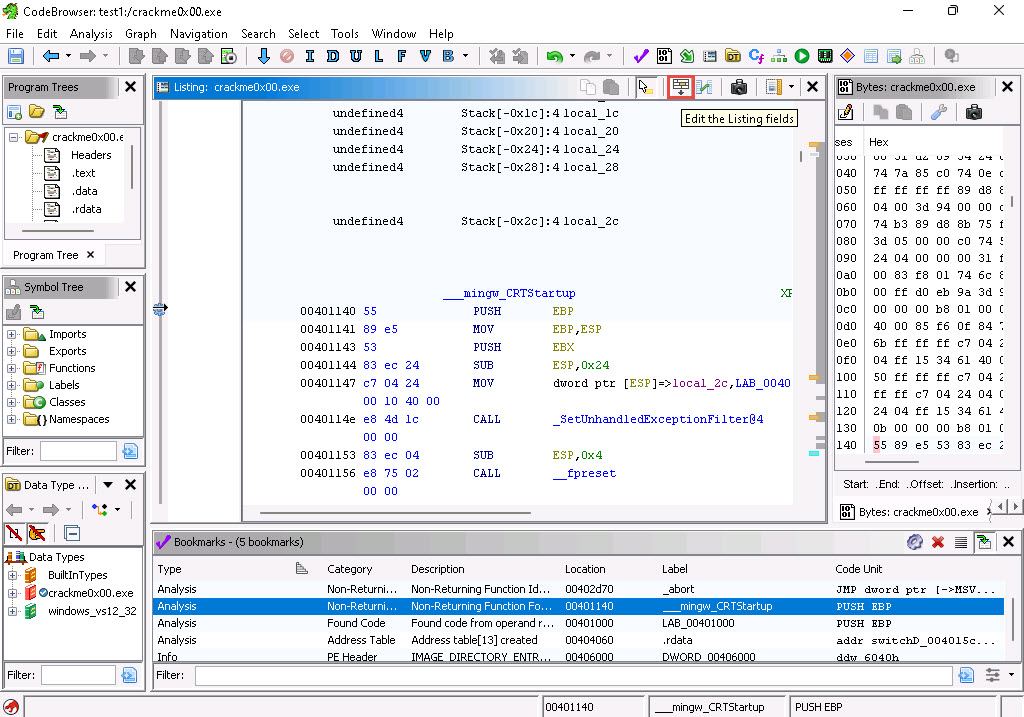
2025-01-13_10-47-15.jpg 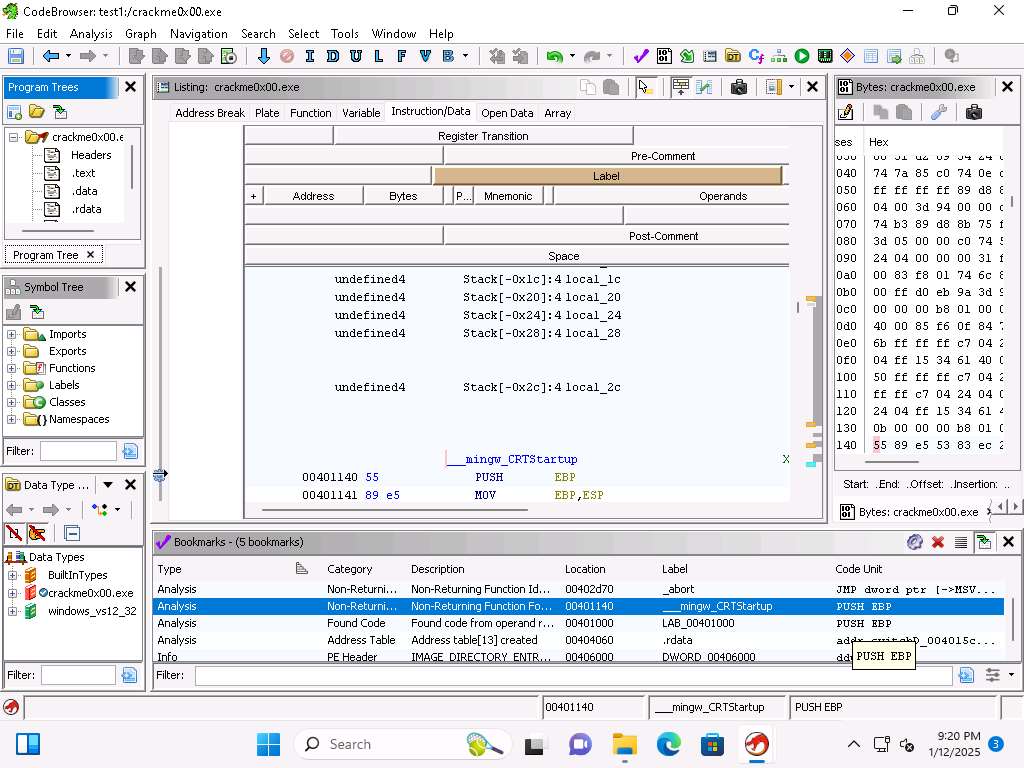
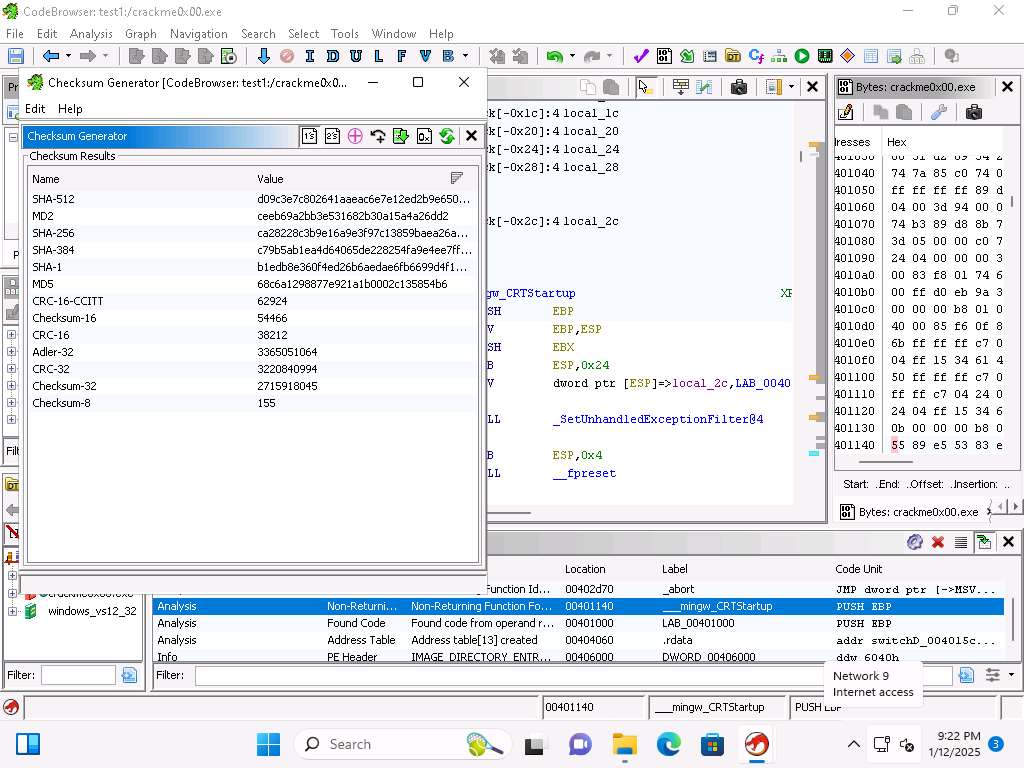
Screenshot Another feature of the tool is the ability to create checksums on the fly. Click Window --> Checksum Generator.
You can on the right-side, select different options, an example of the ones complement setting is shown in the next image:
Screenshot You have another tool, and that is the ability to enter comments into the code which can assist us when we are "deep" into the reverse engineering process.
You can view the C code if you click on Window --> Decompiler.
Take a few minutes and explore the decompile window and options
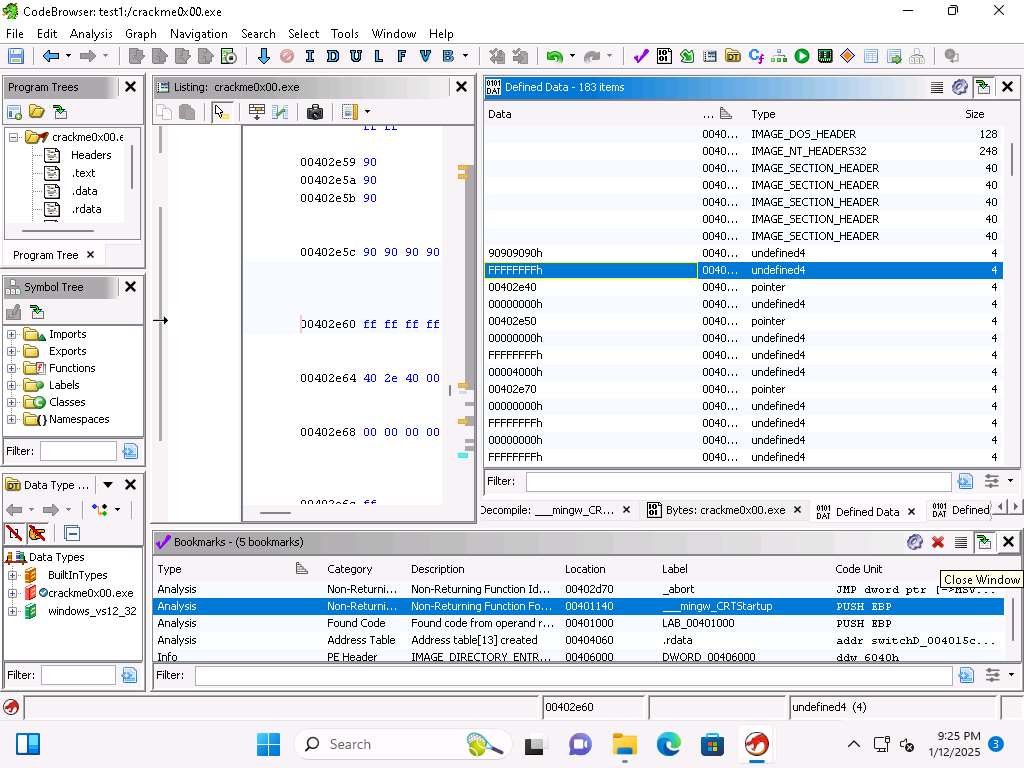
Screenshot Click on Window --> Defined Data.
You can click on different areas in the listing and you will see the code section displayed.
Screenshot Next, we will review the strings, click Window --> Defined Strings.
Click on the Invalid Password and review the code in the listing.
Screenshot Next, click Window --> Disassembled View.
With disassembly we process the bytes into assembly language instructions.
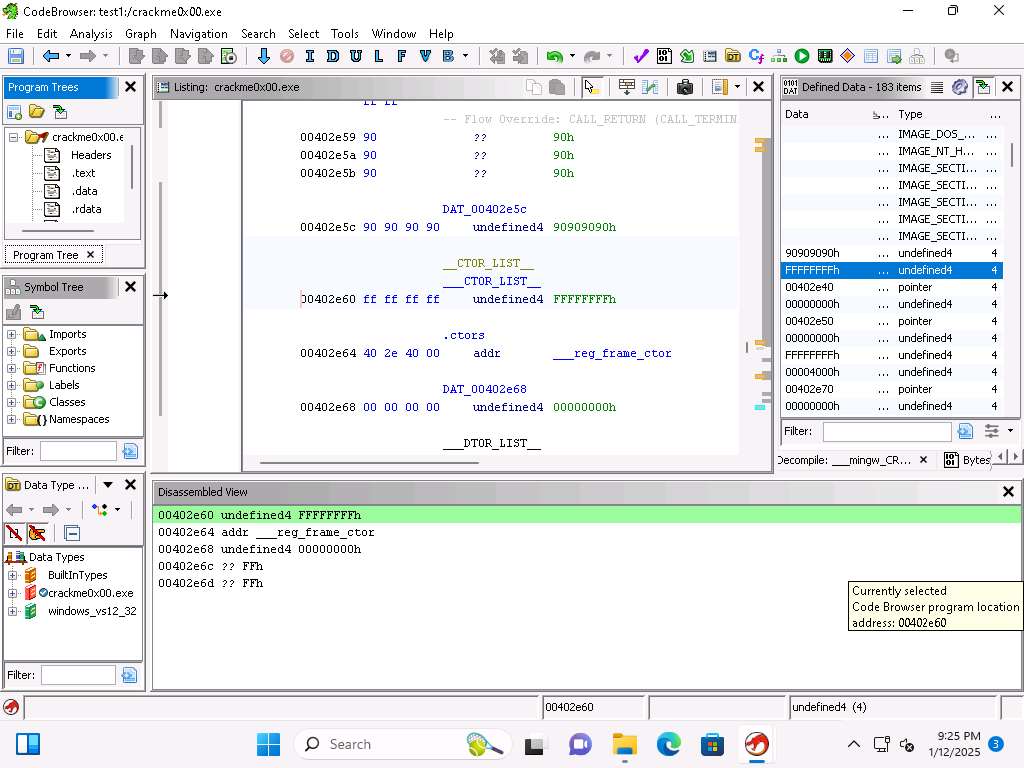
Screenshot In Ghidra, we have 3 different types of disassembly options
Starting disassembly
Starts at the current cursor location Restricted disassembly
Only bytes in the current section can be disassembled
Disassembly
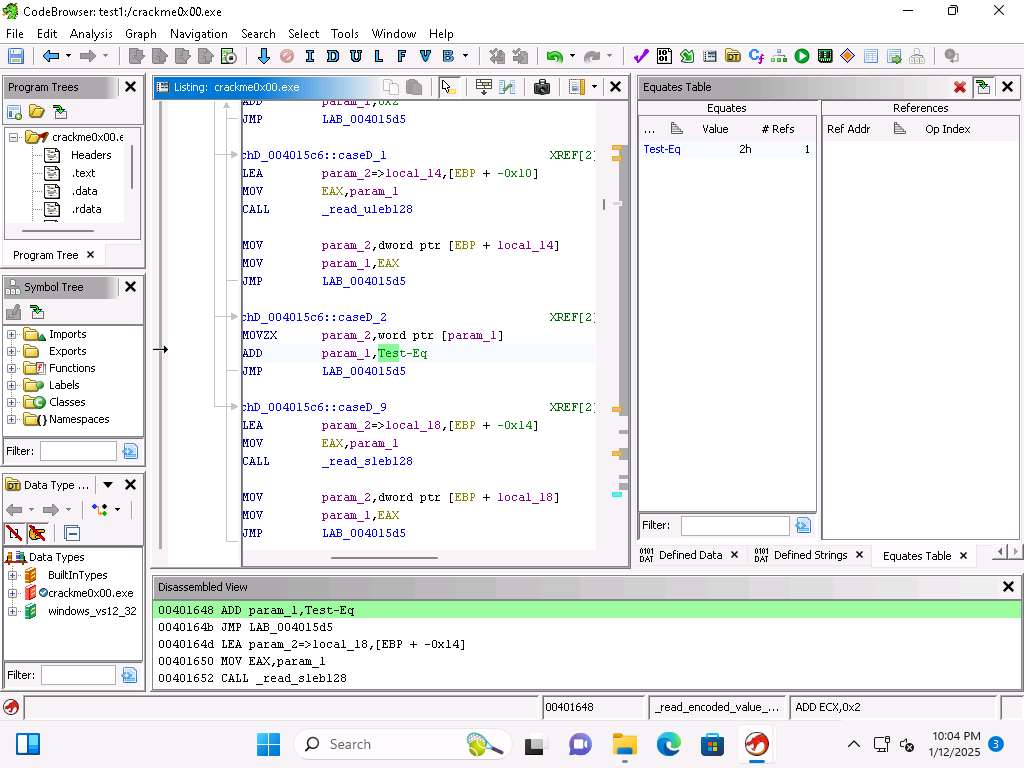
Click Window --> Equates Table.
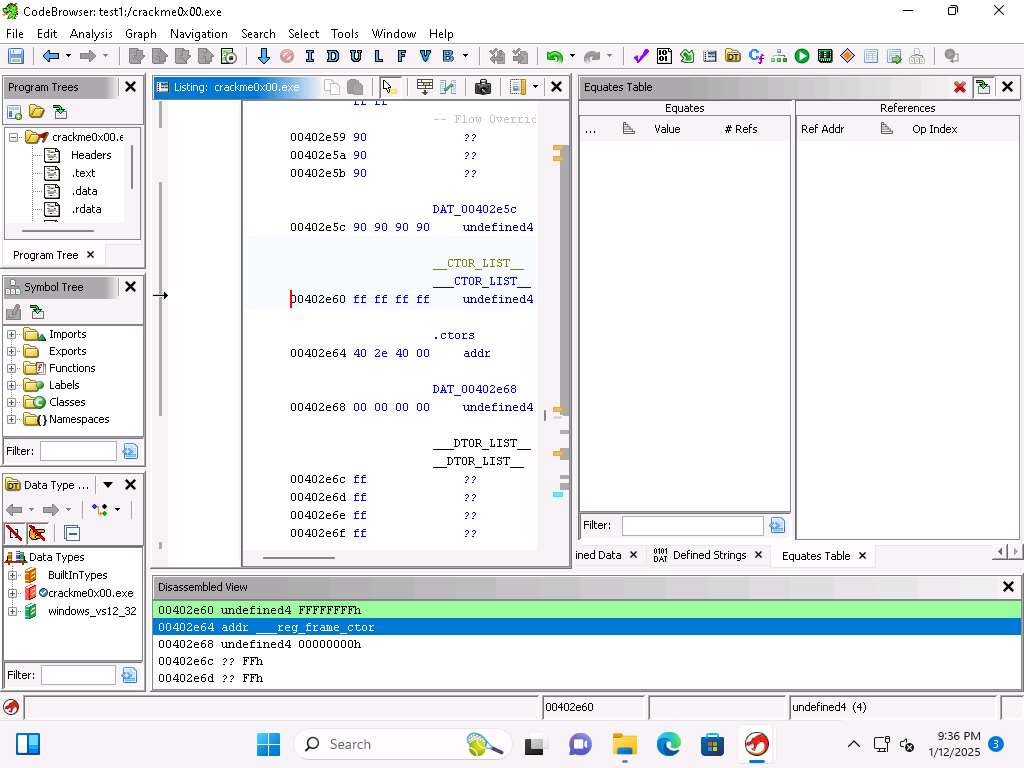
Screenshot We need to find a value that we can use, go to address 00402340.
Select the 0x2 and then right-click it and select Set Equate….
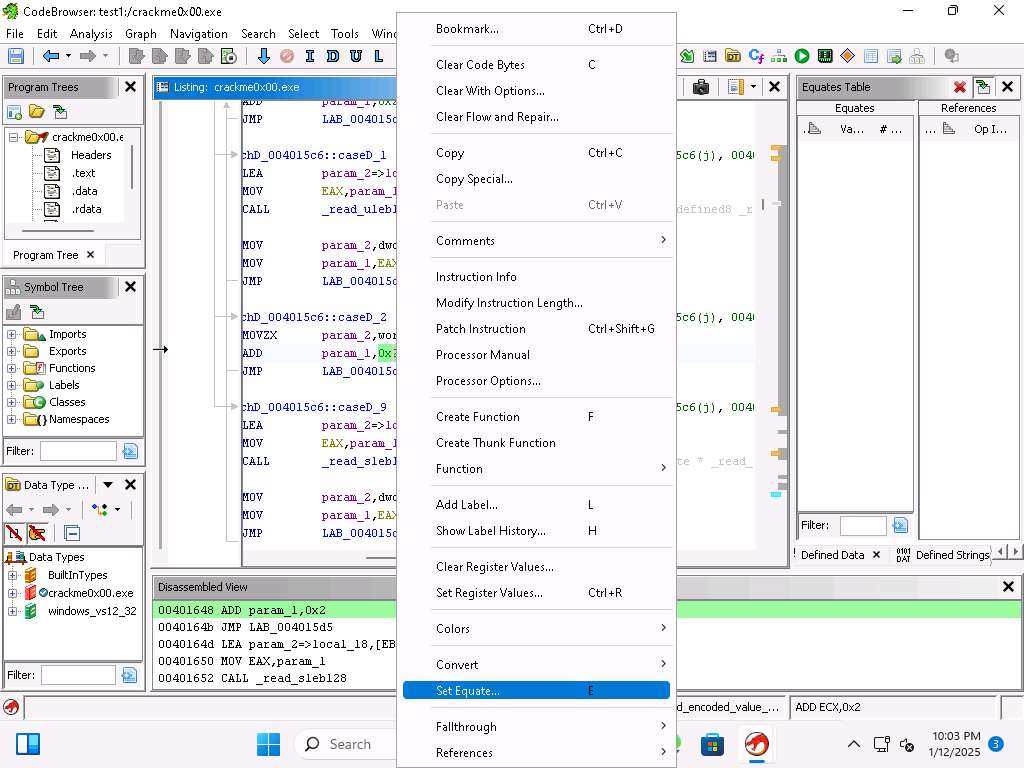
Screenshot 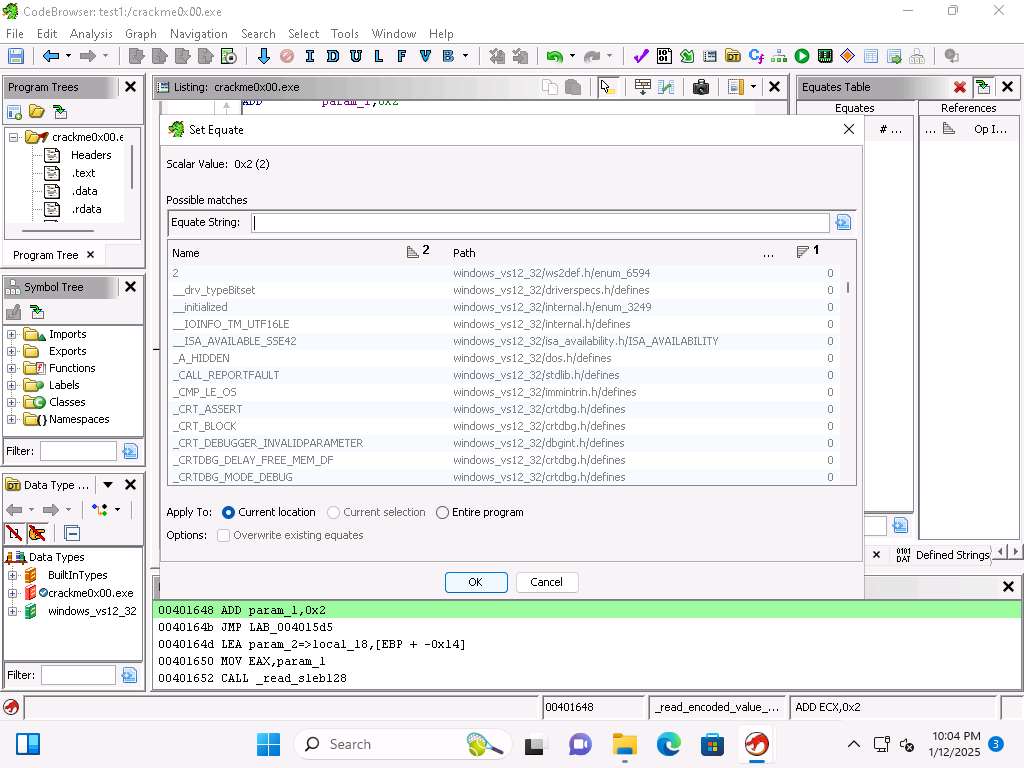
Screenshot Enter Test-Eq for the Equate String.
This will replace the 0x2 with the entered string and the value will be listed in the Equates Table.
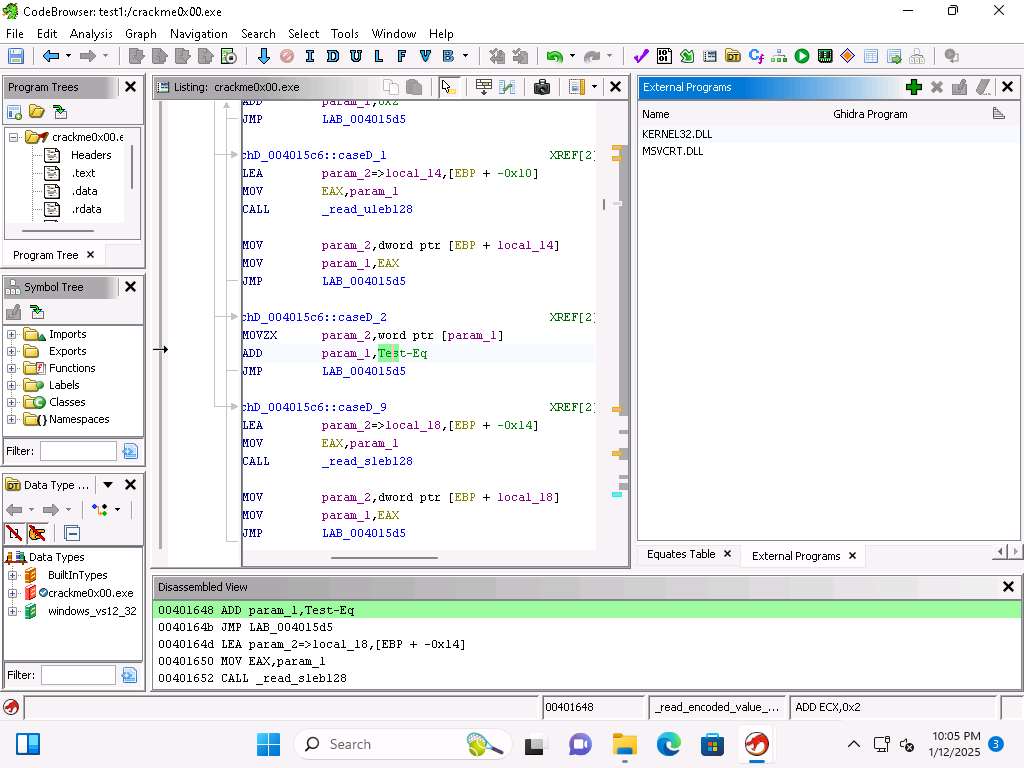
Screenshot Click Window --> External Programs. This will show you the references to external programs.
Screenshot Click on Window --> Function Call Graph.
This graph shows us the incoming and outgoing calls, this provides us a representation for the context of the functions within the program.
The function calls might vary when you perform this lab.
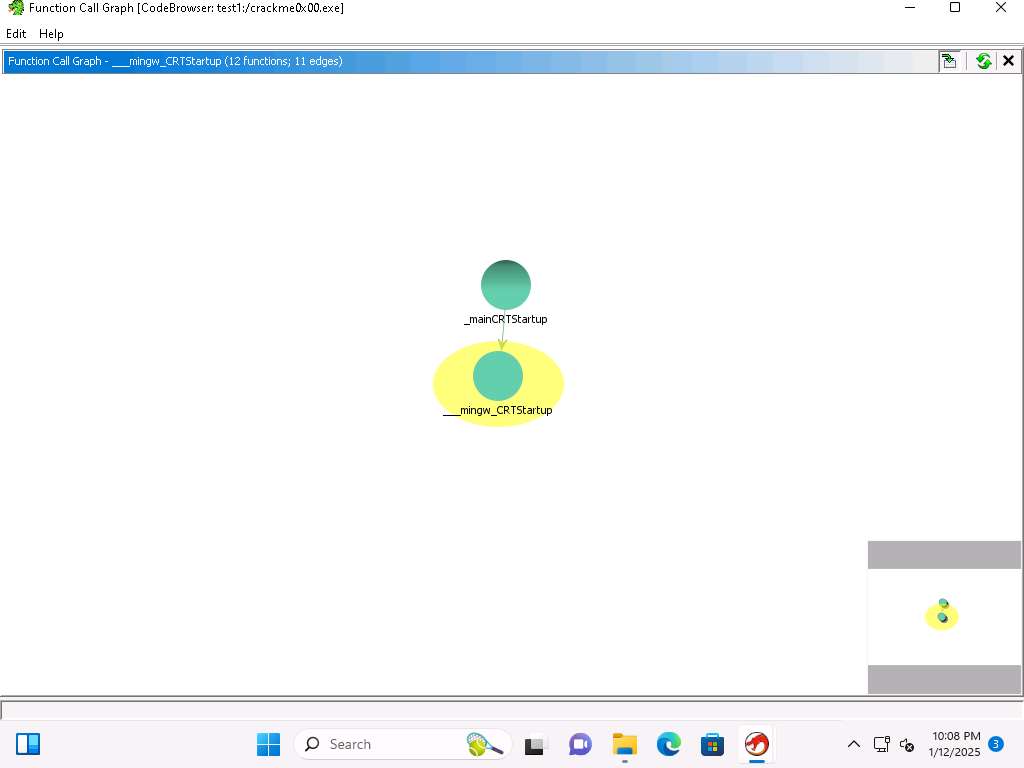
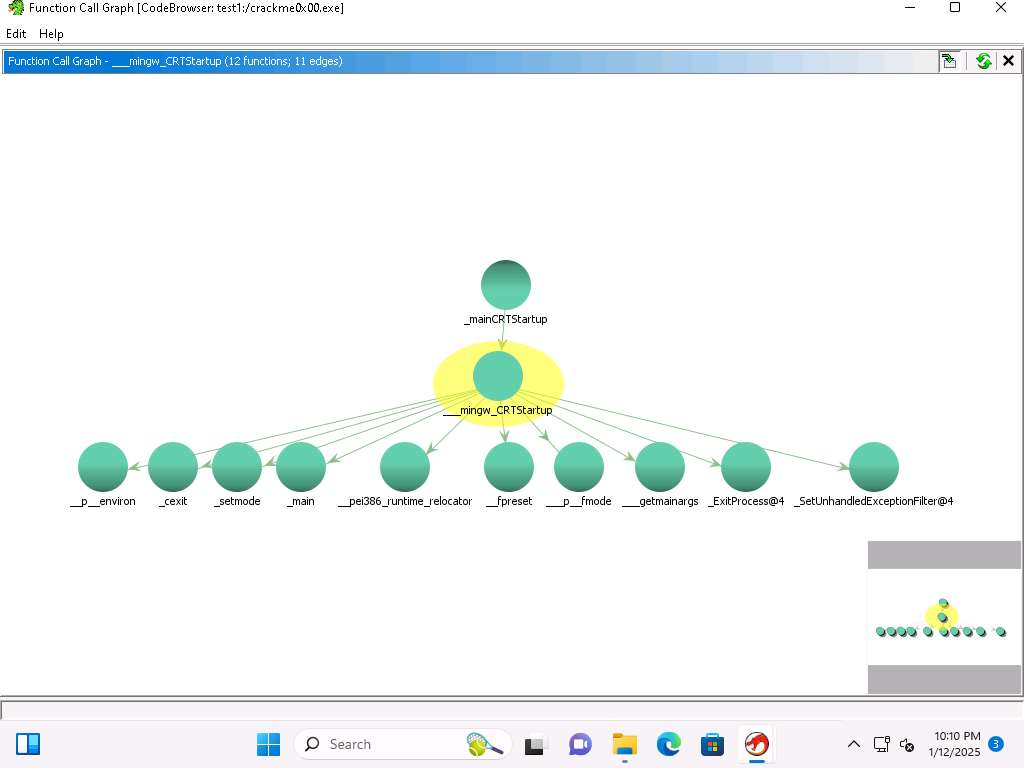
Screenshot Level one is the source function, then the calls are at level two. In the function listing, locate the main function and select it then view the Function Call Graph of it
You can see that the CRTStartup function calls mingw, you can click on the + sign there and it will expand it out. Take a few minutes and explore the different functions when you expand them
Screenshot Click Window --> Function Call Tree.
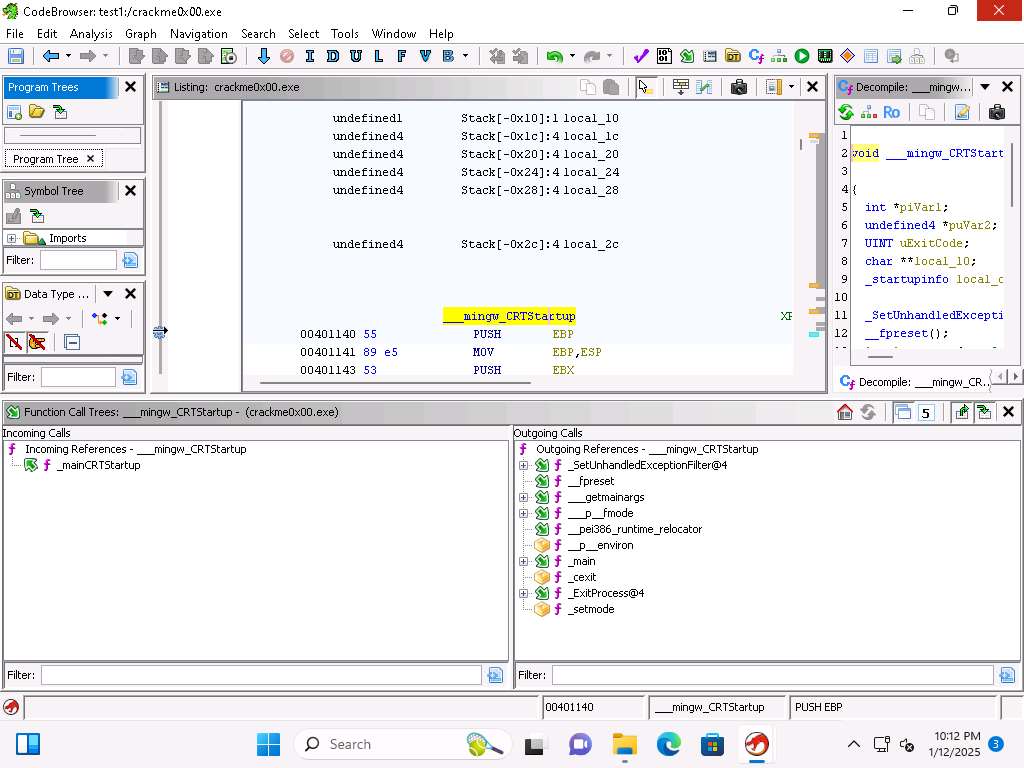
Screenshot This shows all the functions called and the calling functions for the current address.
Take a few minutes and explore these options, then click Window --> Function Graph.
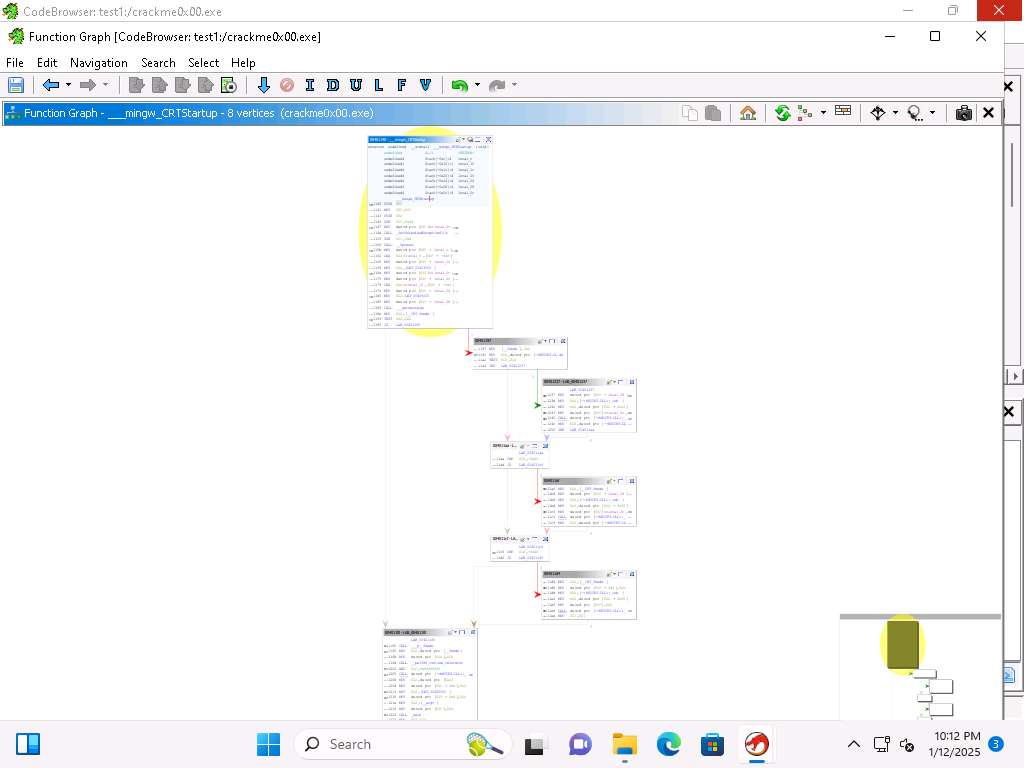
Screenshot This shows a Function Graph in a basic block form which is a straight-line call sequence with no branches except the entry and the exit
You can highlight a section by clicking on the color selection
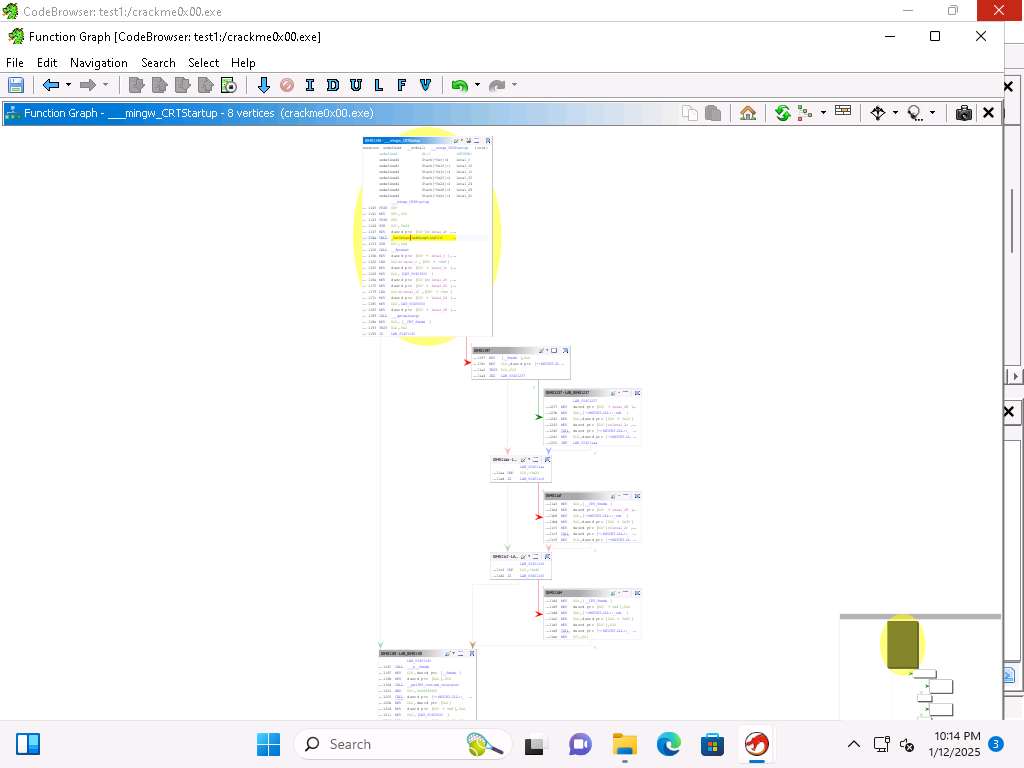
Screenshot The order of the graph can be changed as well. Take a few minutes, and explore, if you want to take it back to the original, just reset it using the menu option at the top right
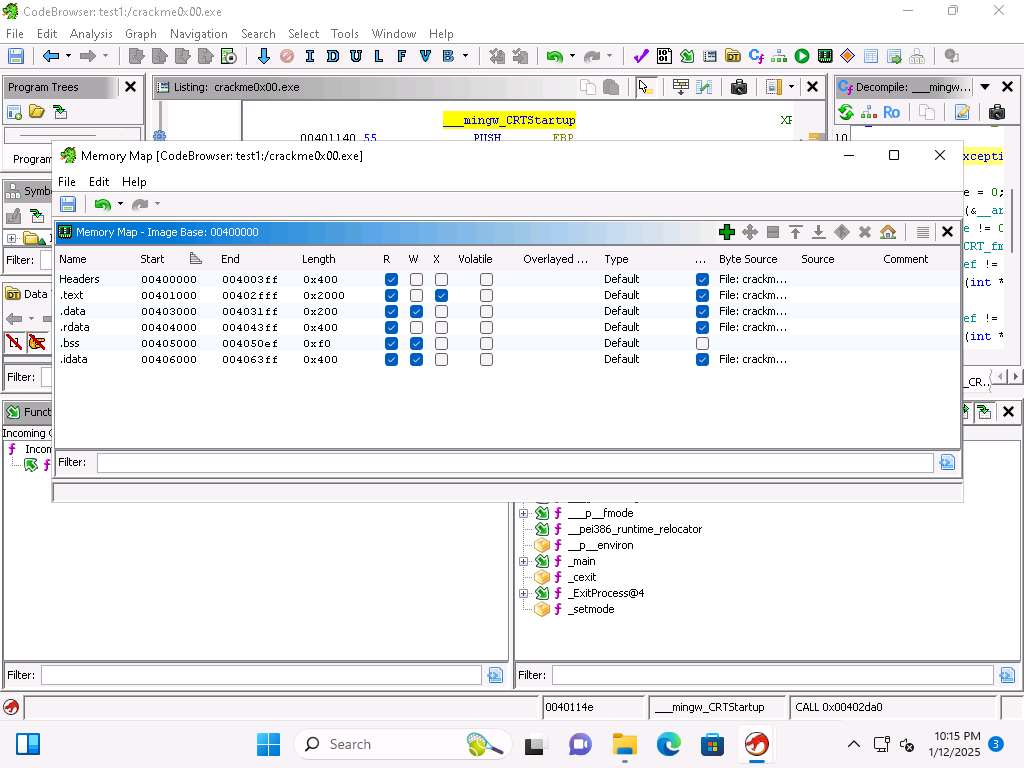
Click Window --> Memory Map. This will display our memory and sections headers
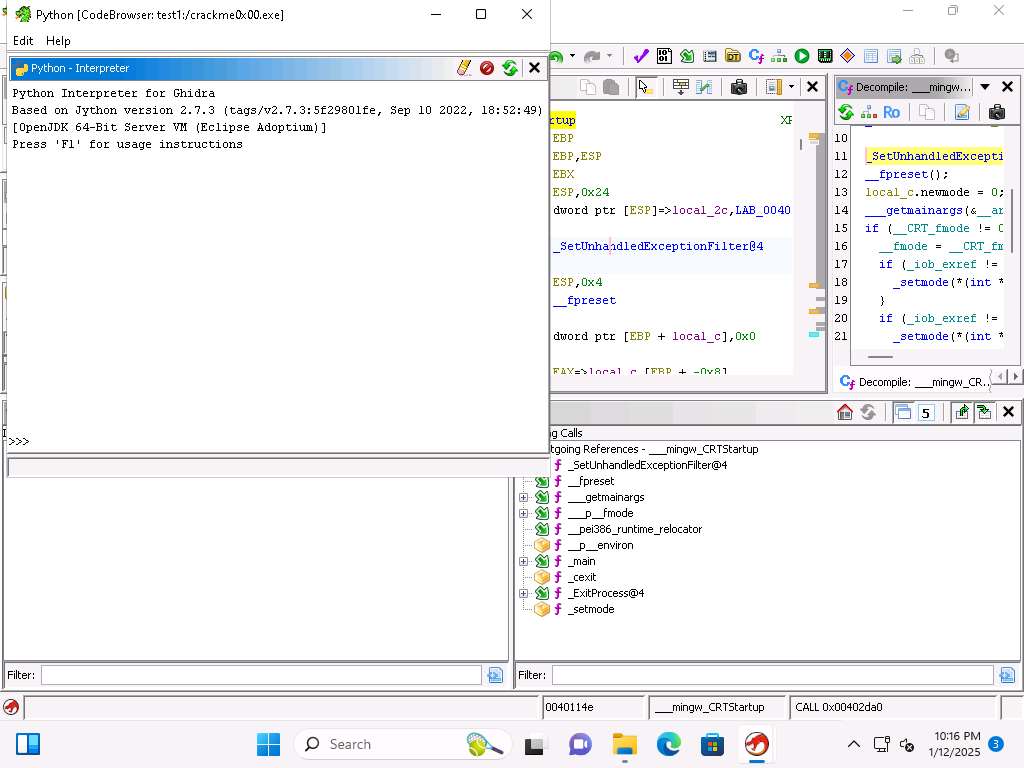
Screenshot We also have an integrated Python interpreter, at Window --> Python.
Screenshot There are a more than 200 built-in scripts, click on Window --> Script Manager.
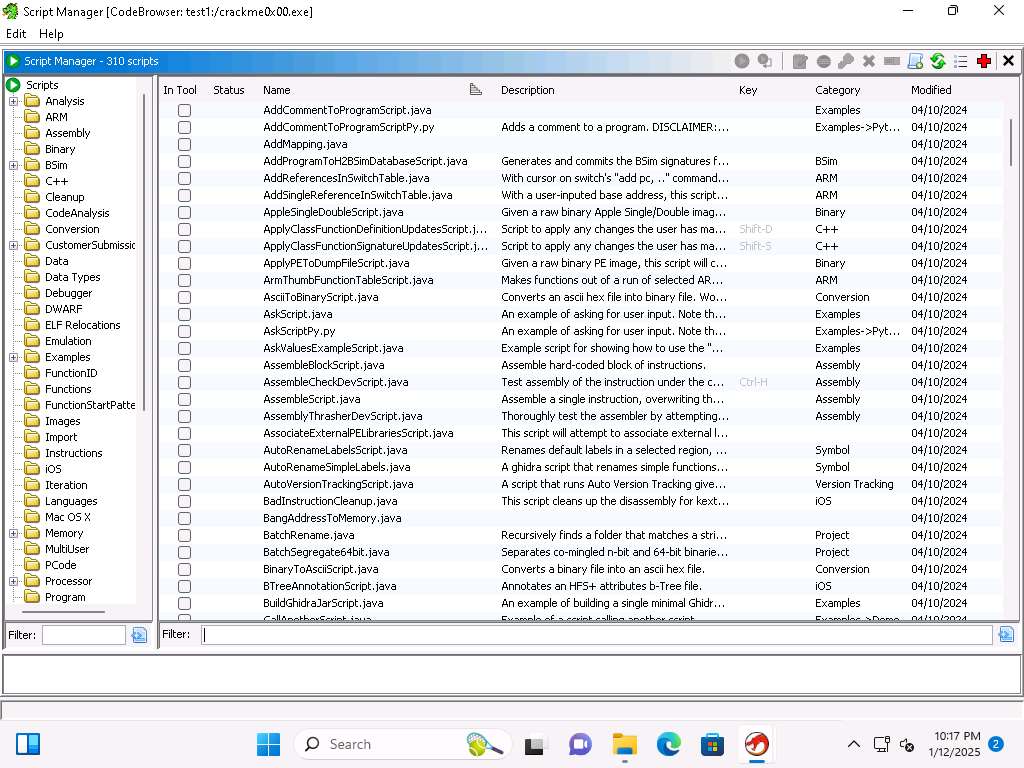
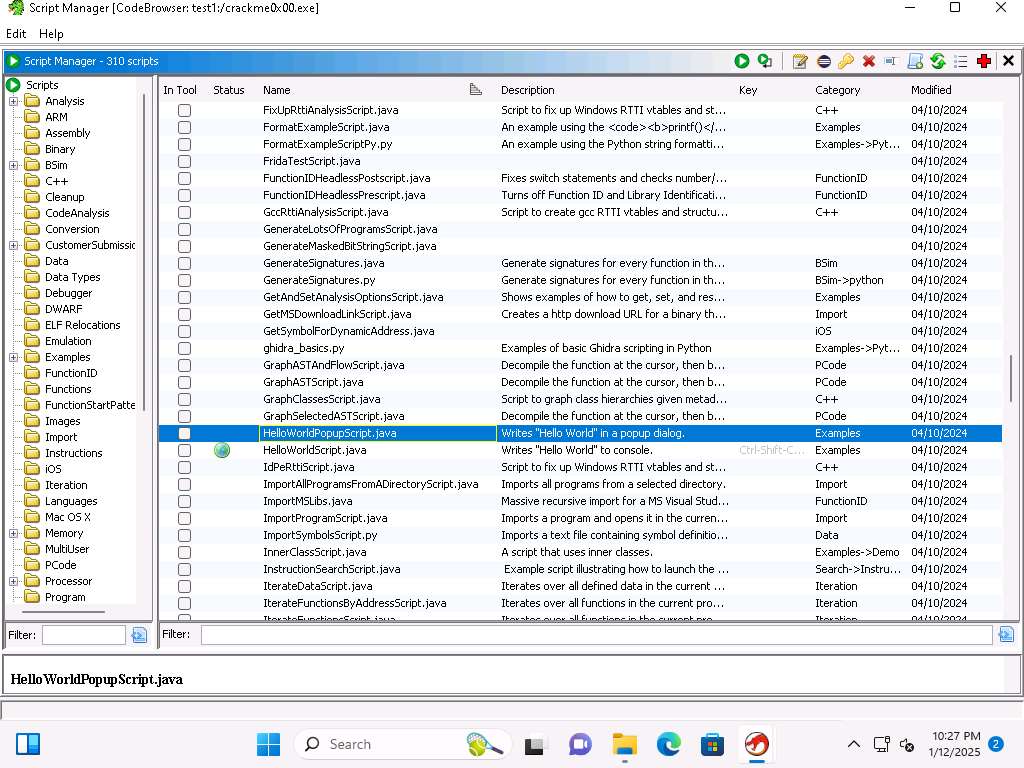
Screenshot Scroll down and locate the Hello World script. Click the play button to run it.
Screenshot 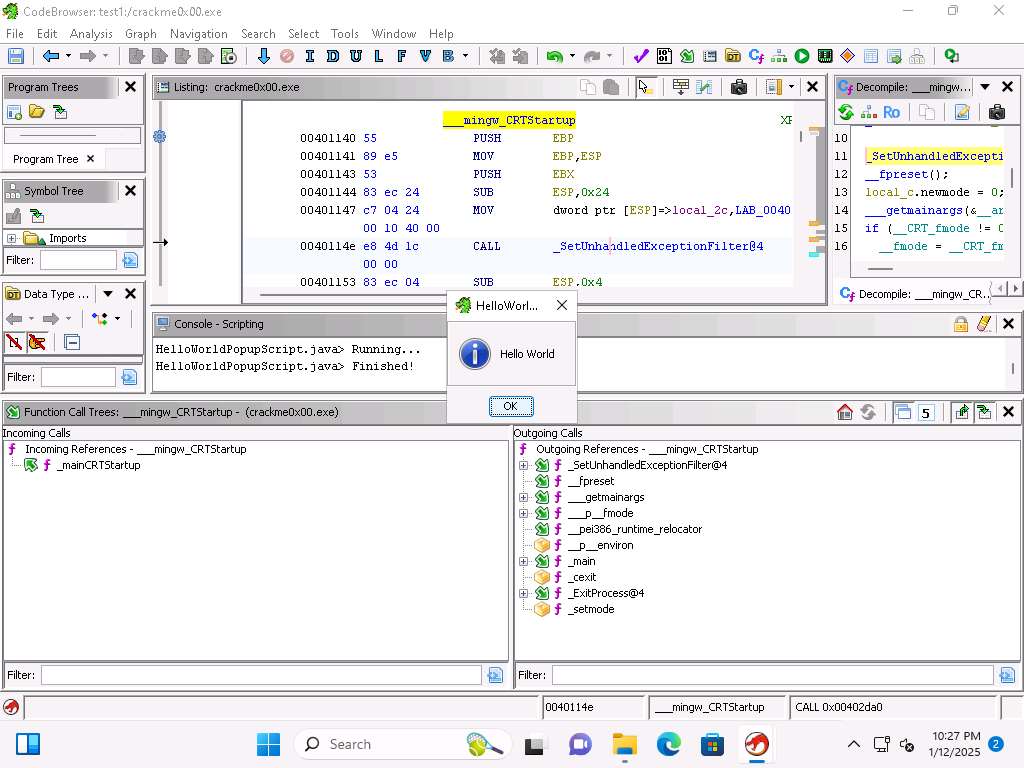
Screenshot Take a few minutes and explore the different scripts
Click Window --> Symbol References, and take a few minutes exploring the different symbols
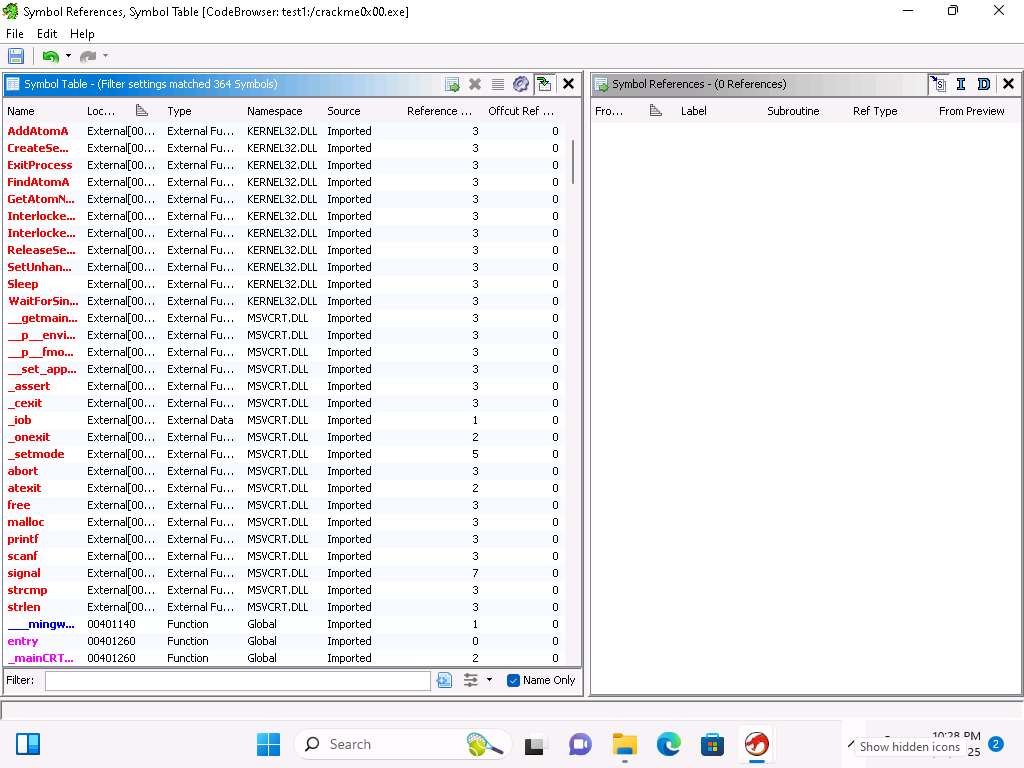
Screenshot We have accomplished what we wanted to for this exercise and will conclude here.
Close all open windows.
Now, we will analyze the crackme0x00.exe file to find the password.
Open a Command Prompt window, and navigate to C:\Users\Admin\Downloads\Tools run crackme0x00.exe command to run the file from a command prompt window.
As the image shows, the program prompts for a password. Enter 123456 to see how the program responds
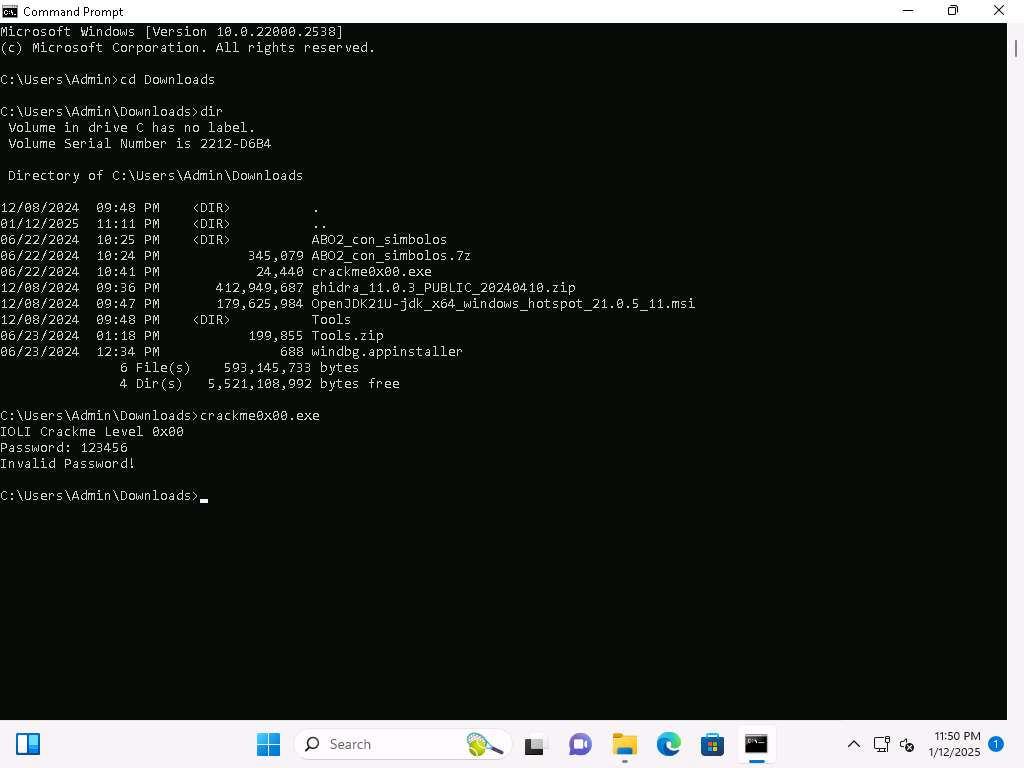
Screenshot As we see, we did not get lucky with the password, so we will have to continue with an analysis
We could sit and try some more common passwords, but we want to crack it
The process is we will run the binary executable file through the Ghidra tool. Open the binary tool in Ghidra
Before importing the binary delete the crackme0x00.exe file from test1 project.
If you are unable to view OK button then resize the Import Results Summary window.
When the tool opens, you will see that the file has not been analyzed, click Yes and in Analysis Options check WindowsPE x86 Propogate External Parameters checkbox, this can assist our analysis by including comments next to the instructions and click on Analyze.
Screenshot 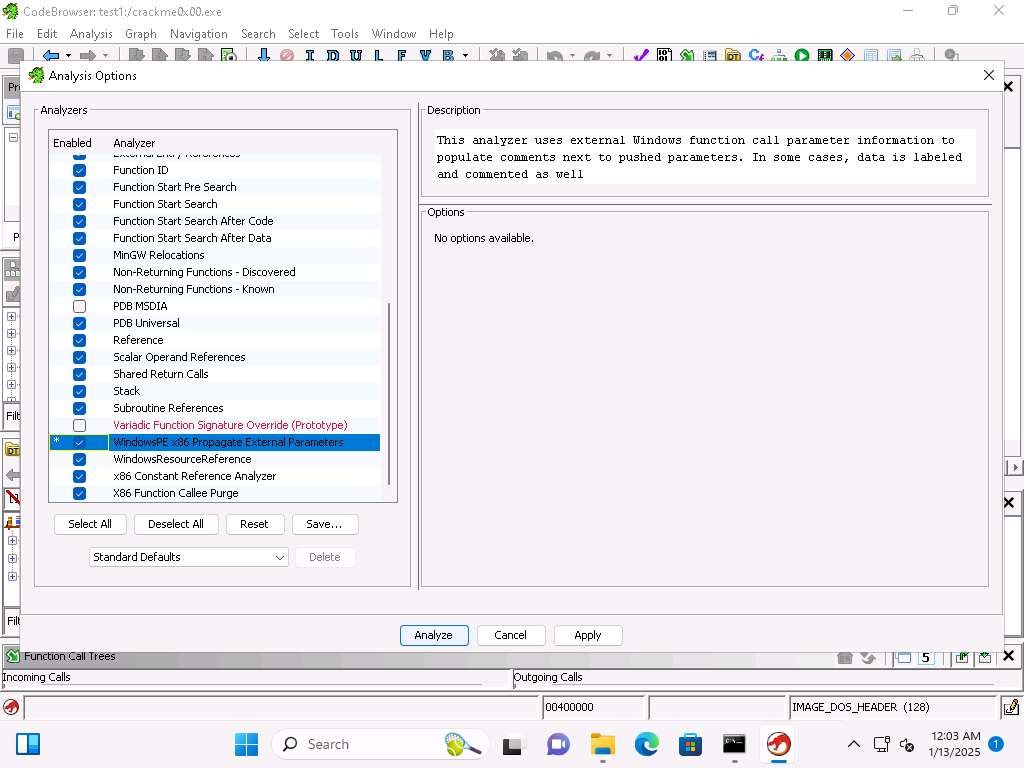
Screenshot This will take some time to complete. Once it does, open the Functions and the Listing windows if they are not displayed
Take a few minutes and review the list of functions, this is where you can see what functions are within the binary and the called functions.
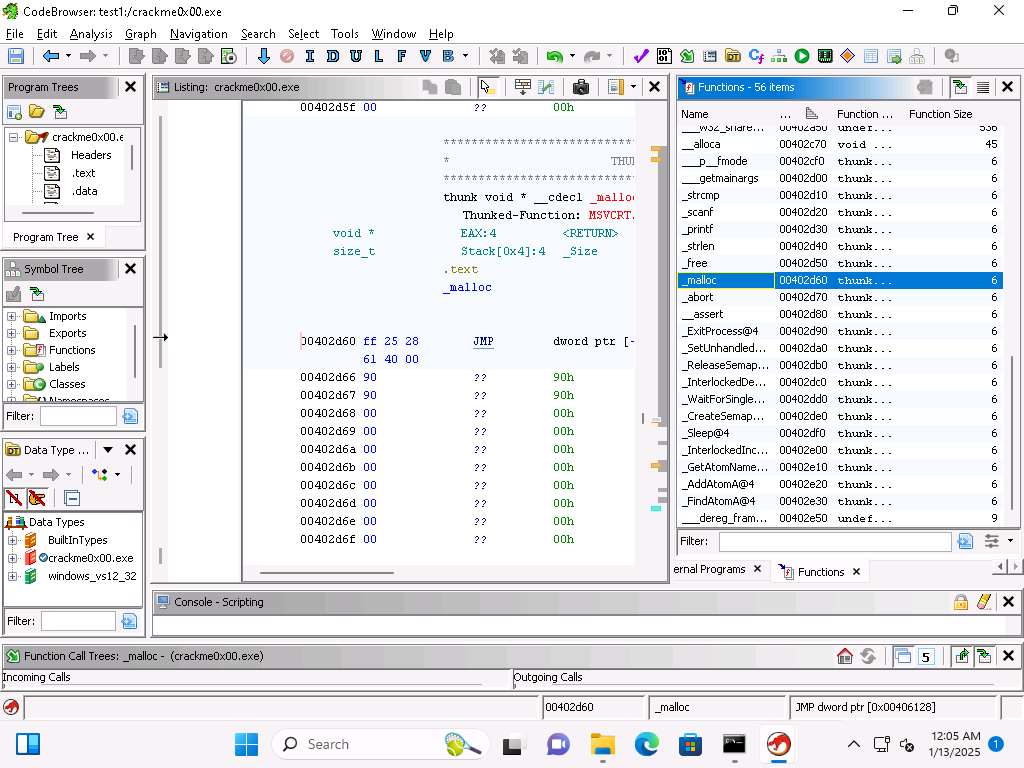
Screenshot You will see some classic programming functions. As the image shows you can see strcmp and malloc for example of common functions.
When you select the function you can see it located in the listing with the assembly language.
Lets take a look at the strings, click Window --> Defined Strings. We can see in the image the word Password etc.
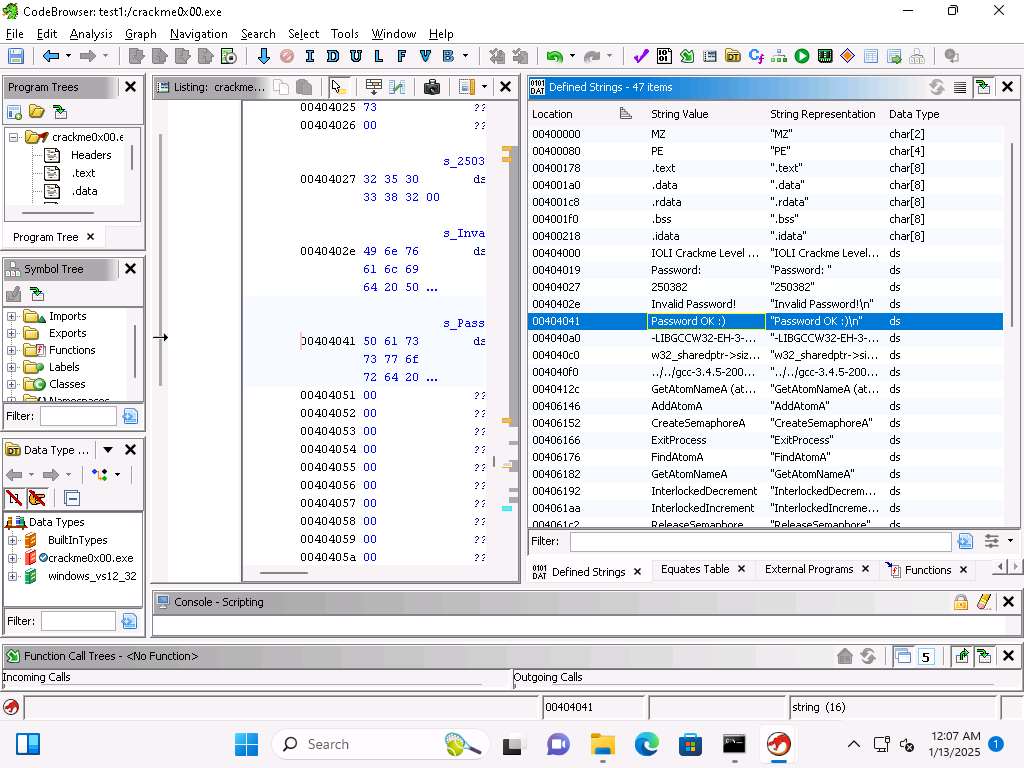
Screenshot Take a few minutes and review the different strings.
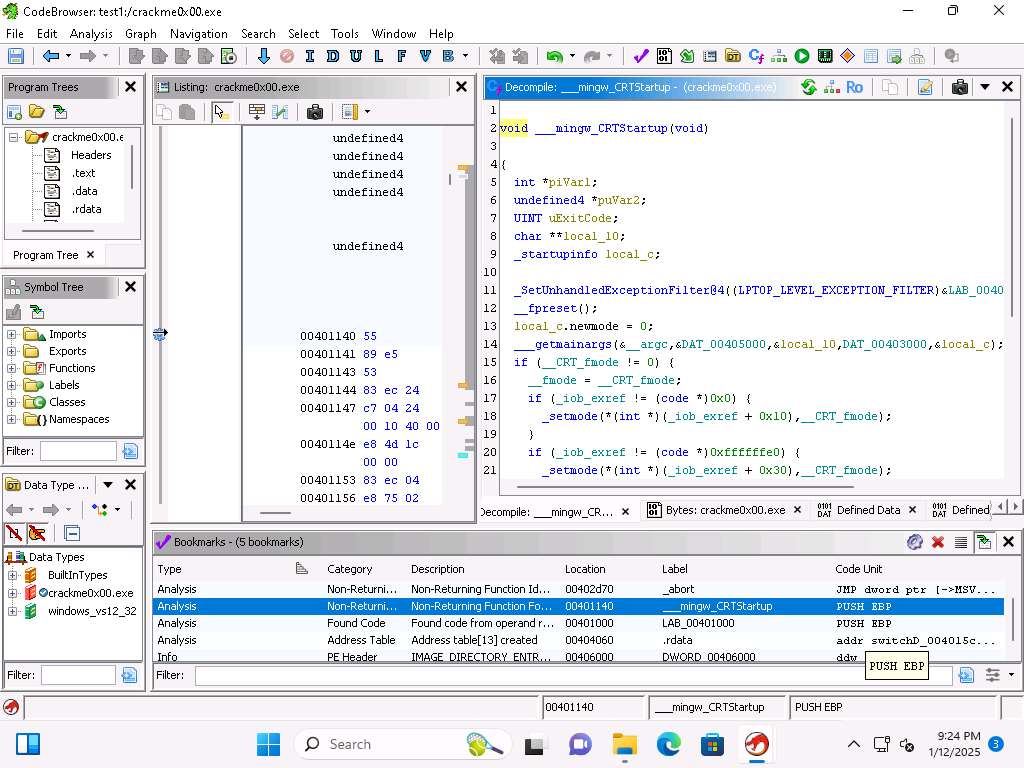
In the listing for the functions, click on the main function.
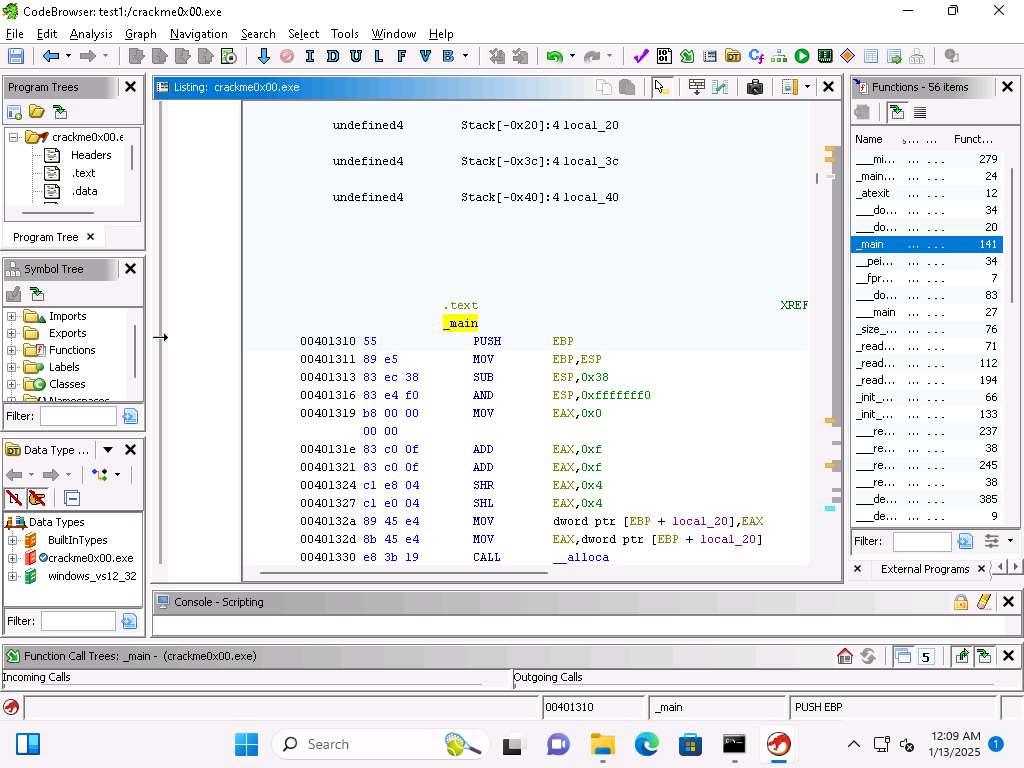
Screenshot At the beginning of the section we see the PUSH EBP.
This is where the base pointer from the previous function is pushed onto the top of the stack.
The instruction MOV EBP,ESP is where the current stack pointer is moved into the base pointer. The SUB ESP,0x38 is where the stack size is increased. As a reminder the stack grows from higher to lower addresses and that is why we subtract

Screenshot The next instruction is used for alignment. Is an AND function which can be used for this, it is an alignment for 16 bits which helps with performance.
This alignment is required because we are in the process of allocation the memory by calling the alloca function.
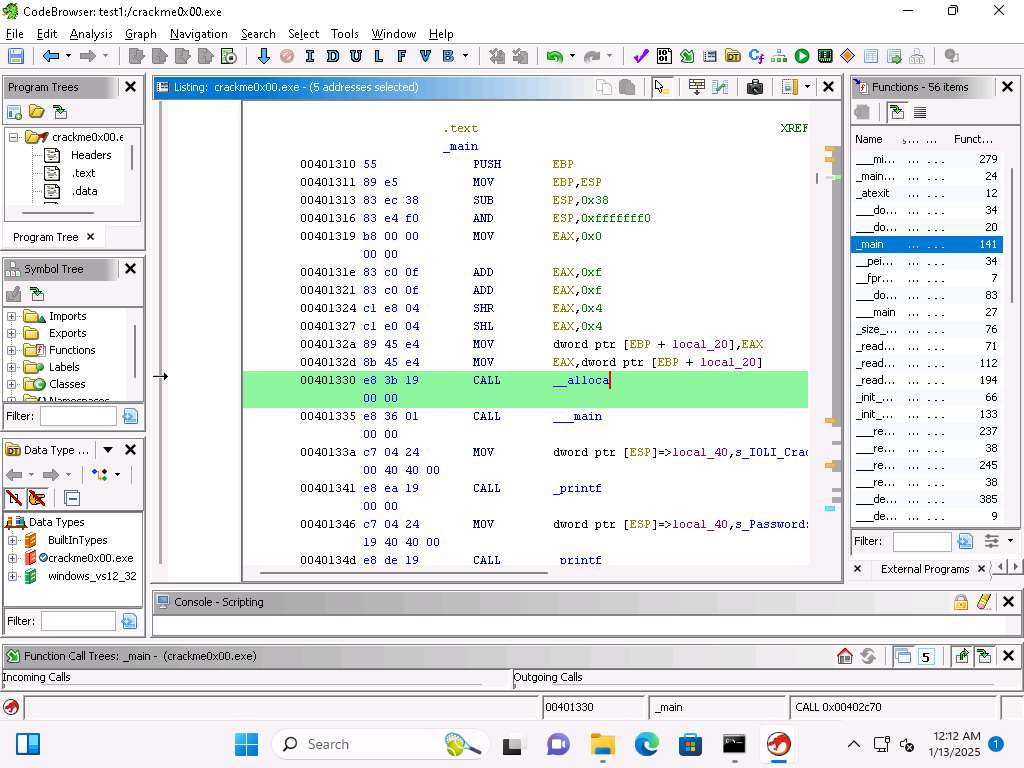
Screenshot The alignment functions were used to setup the memory allocation for the called function.
Below this you will see another call to main, this is by the compiler and not part of the code we are investigating.
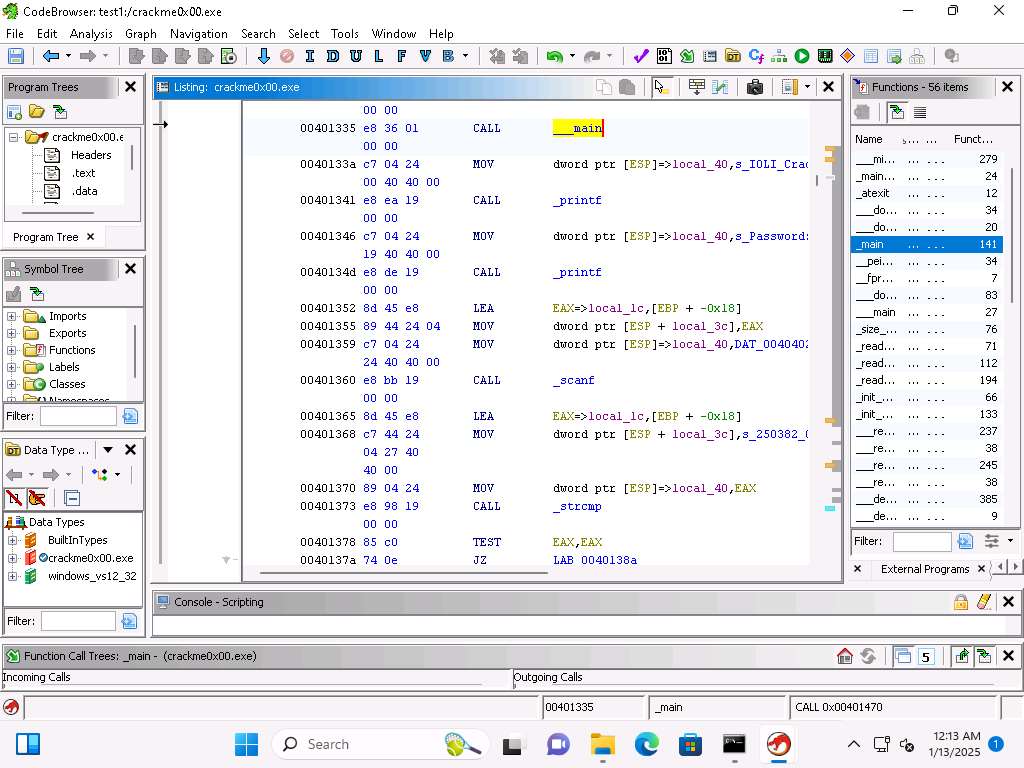
Screenshot We can see where the Ghidra tool has added the local variable local_40 into the instrumentation of the code. Additionally, we can see this is where the password string is being operated on.
As the program waits for the input from the user this is represented with the scanf function.
This can be seen when we are using the LEA, or Load Effective Address and the EBP + -0x18 and the local variable local_1c. Following the LEA the string is moved some more into the stack offsets, and using the scanf takes the data that is input and stores it in EAX.
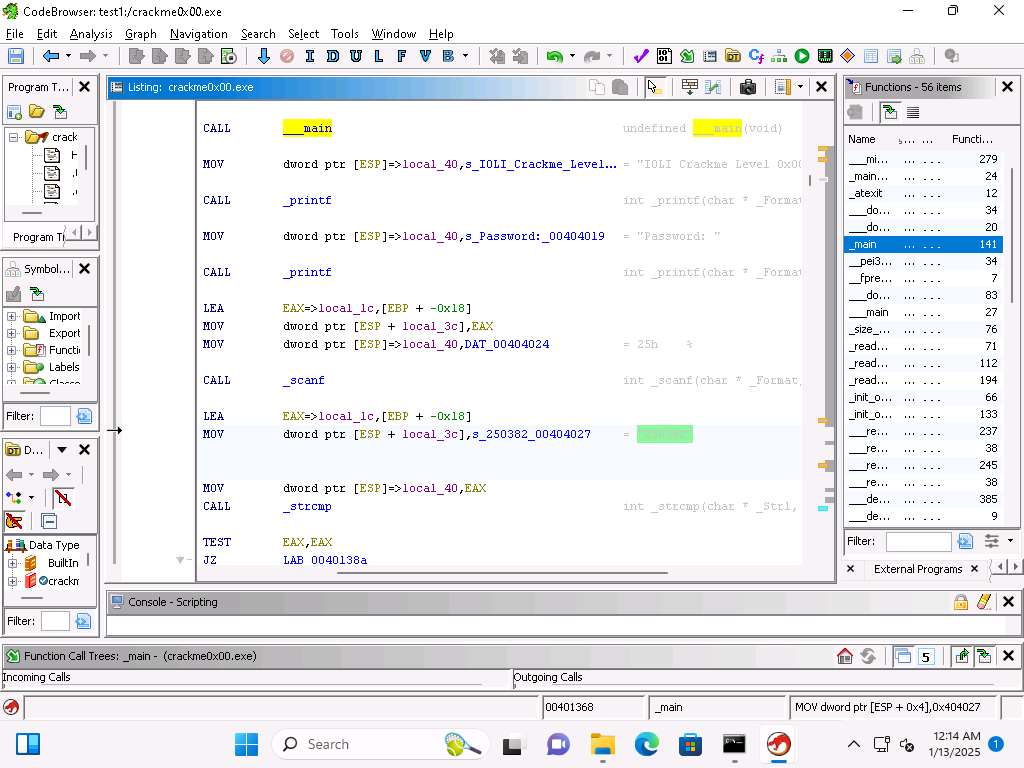
Screenshot We can see that the string is represented by this 250382.
Following this we move the string into the local_40 variable which is at the top of the stack.
Then the call is made to the strcmp function and that compares both of the strings, the password and the value 250382.
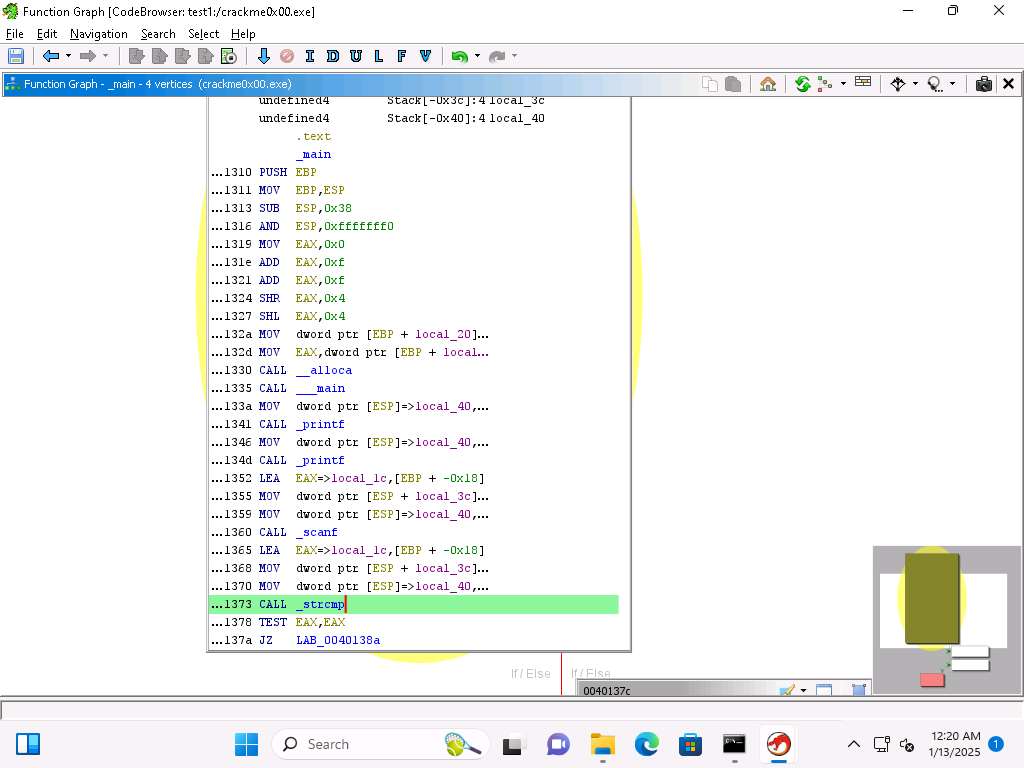
To get another look at this, we can use the Function Graph View, click Window --> Function Graph.
With this view we can see a clear call to the strcmp.
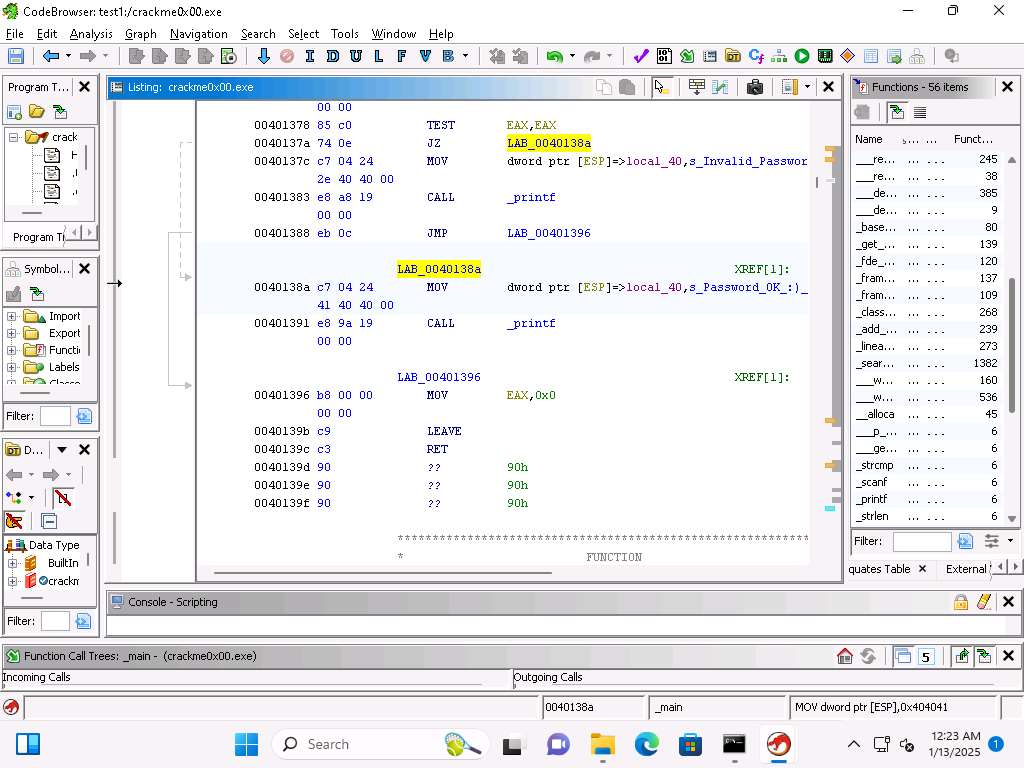
Screenshot We can see after the TEST of the values we have a Jump Zero (JZ) to the address 0040138a.
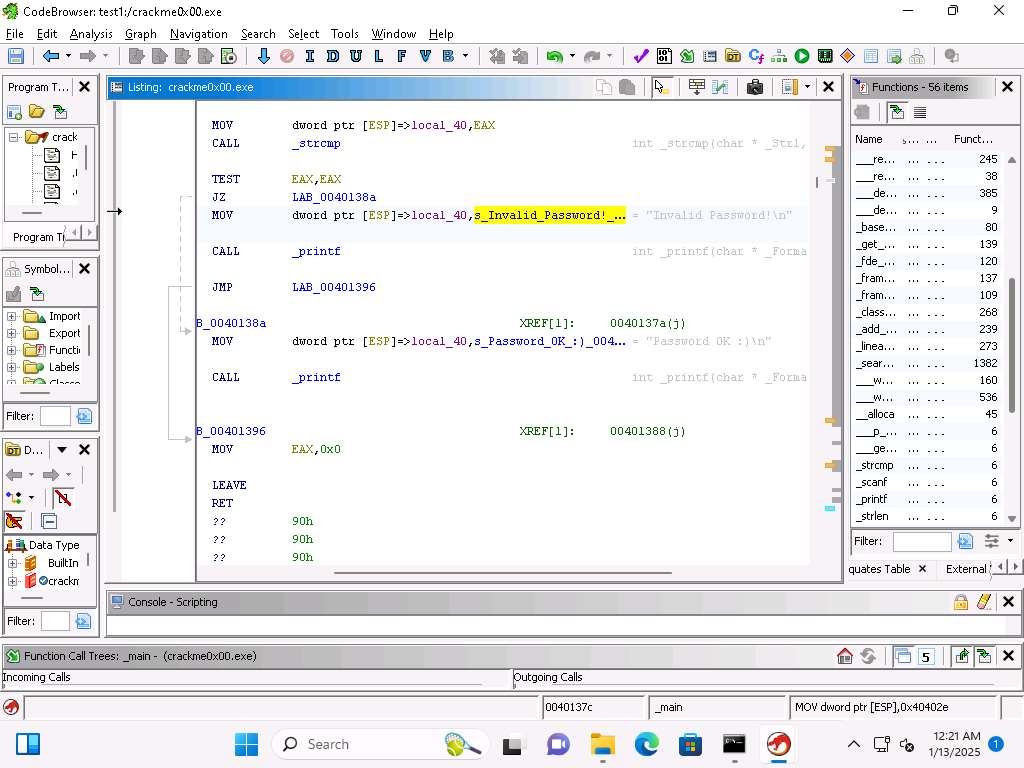
Screenshot That is the address when the password is matched, and then if not we have the Invalid Password, as shown here:
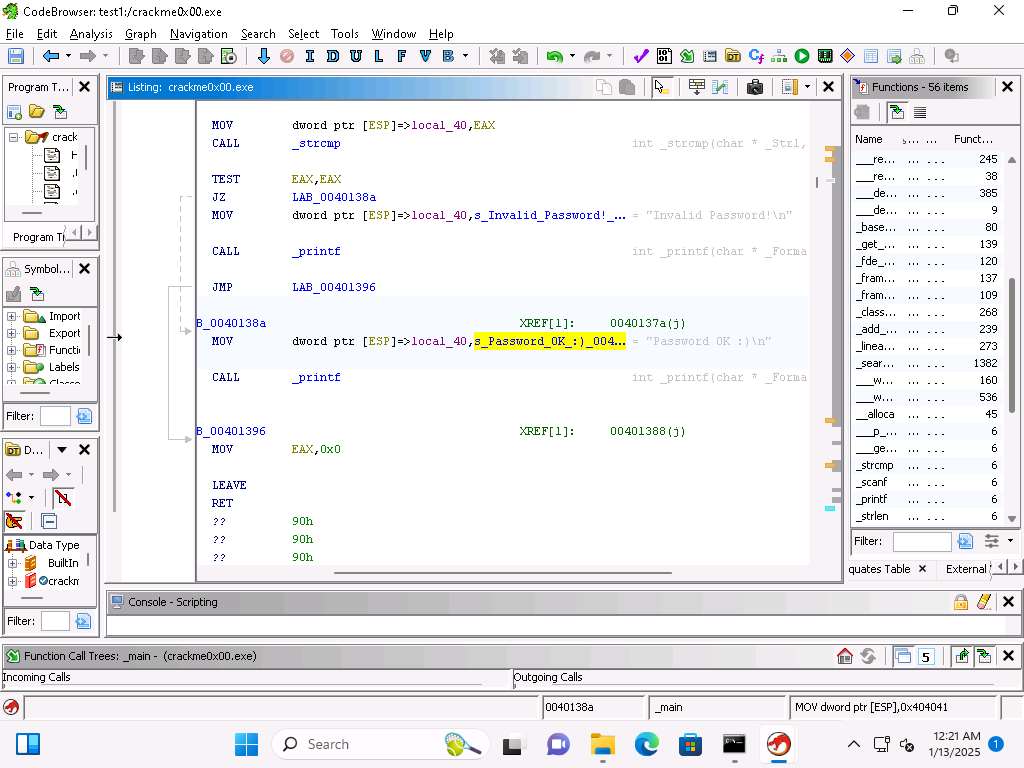
Screenshot Then if the password is matched we have this code here.
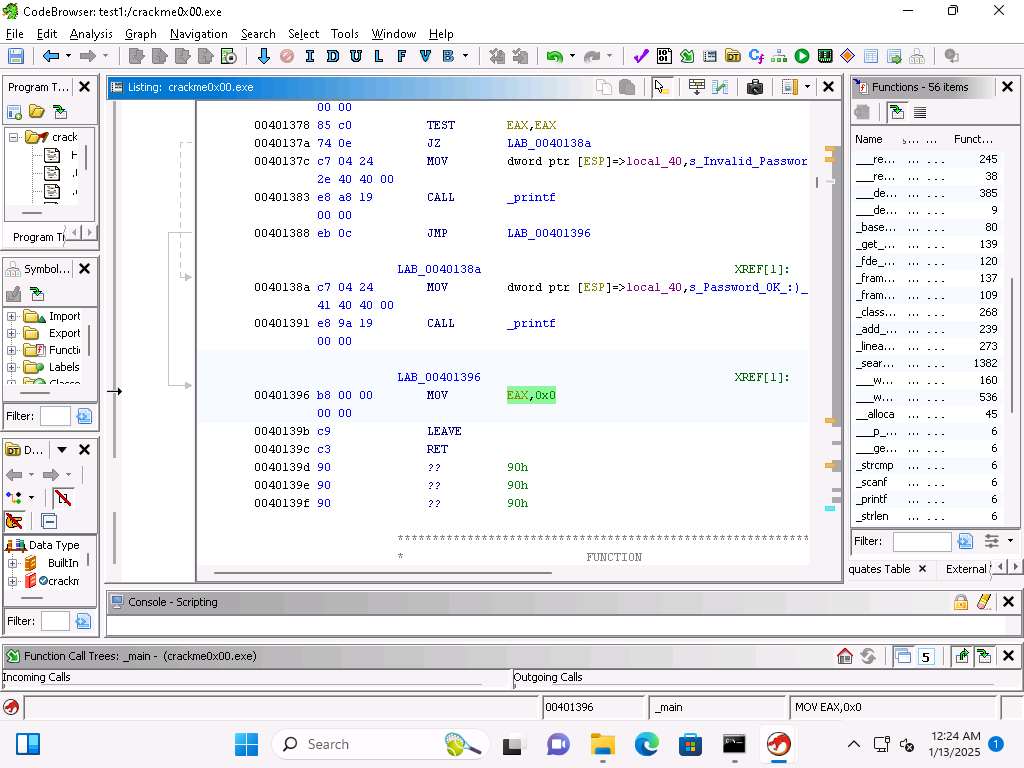
Screenshot You can also see that once the strcmp has completed the next step is to move to the exit function and the values 0x0 is moved into the EAX register.
Screenshot Now, let us test our analysis, run the program again and then enter the password of 250382 and see if that results in the program providing the Password OK message.
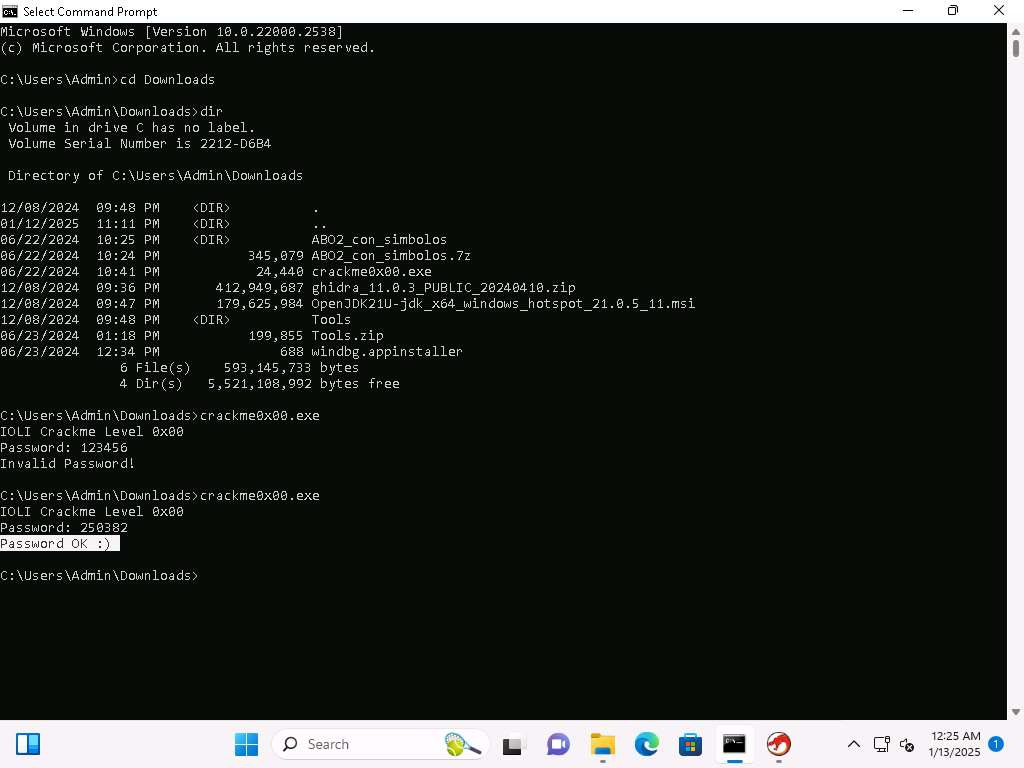
Screenshot This confirms our analysis. Lets decompile now and look at this in Ghidra, click on Window --> Decompiler.
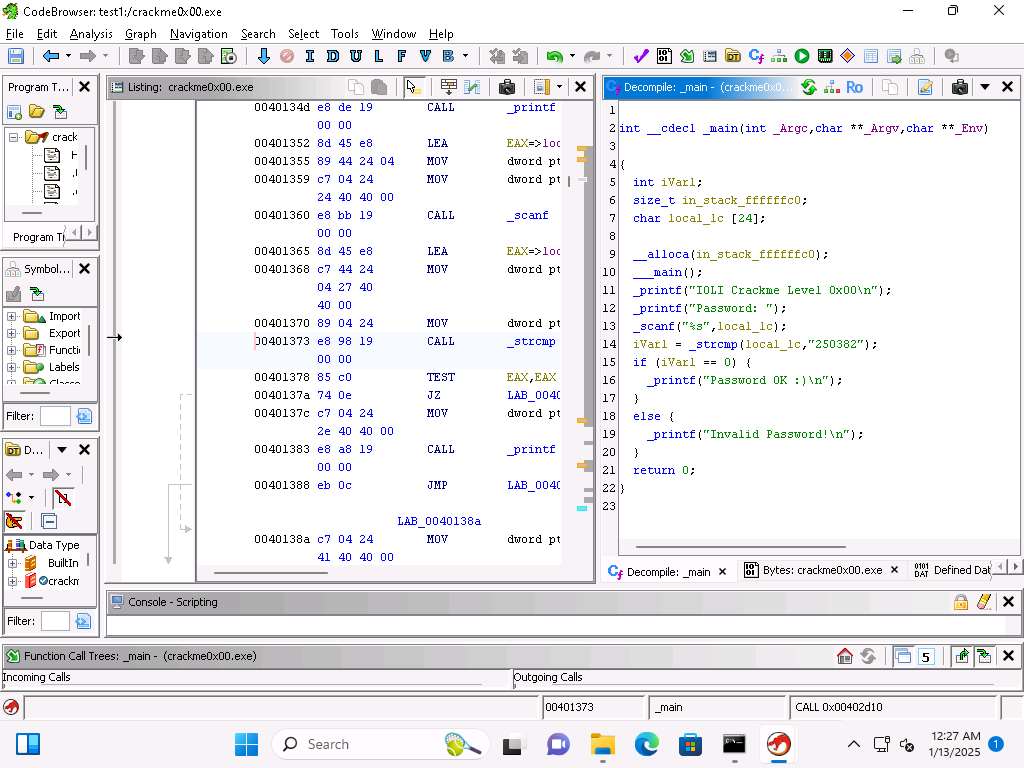
Screenshot This further enhances our discovery of the code via the assembly instructions and validates our analysis.
We have accomplished what we wanted to in this exercise and will conclude here.
Close all open windows.
Last updated