
11. Reverse Engineering with Debuggers
Exercise 11: Performing Reverse Engineering with Debuggers
In this lab, we will explore reverse engineering techniques using the x32dbg debugger to analyze and understand the functionality of a binary application.
Lab Tasks
Now that we have successfully reverse engineered the crackme binary, lets look at another debugger and that is the x64dbg.
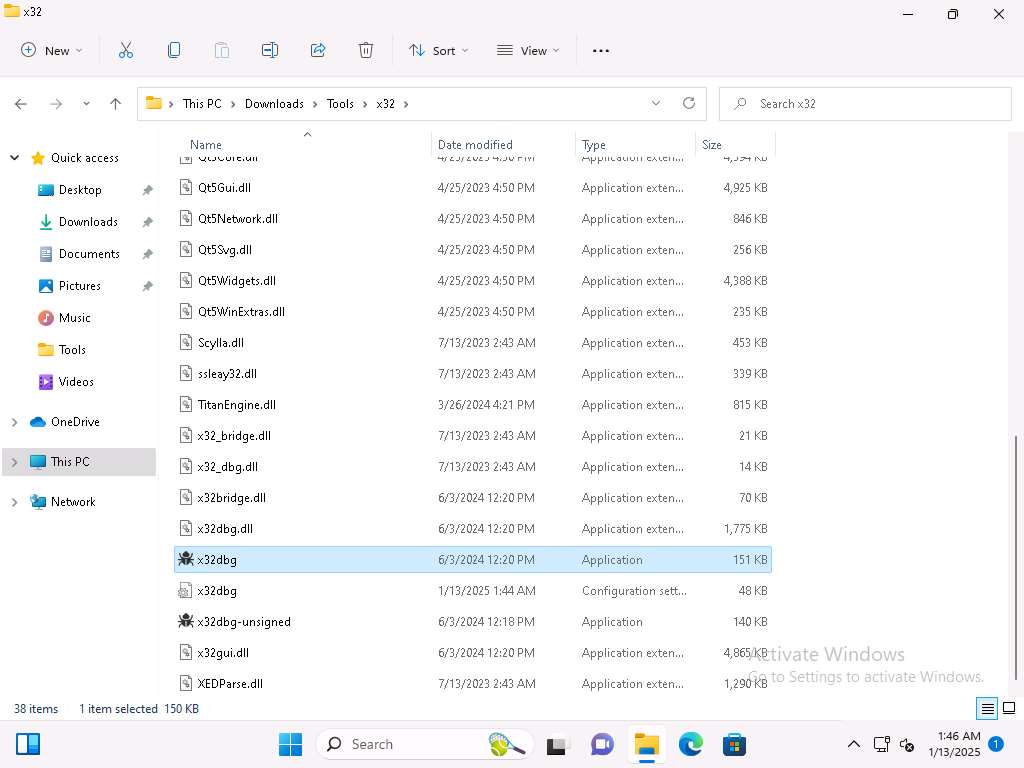
On Windows 11 machine, navigate in the Tools folder to the x32 folder and double-click x32dbg.exe to run the application and then then open the crackme0x00 file in the debugger.
Screenshot 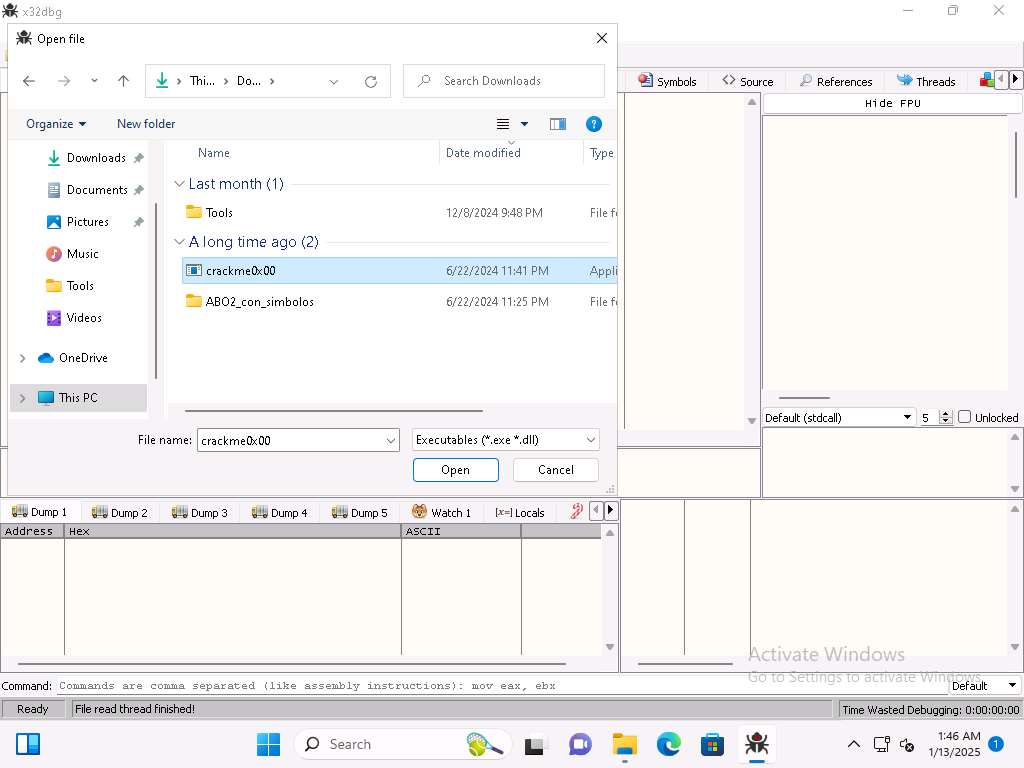
Screenshot Now, we want to set a breakpoint at our main function. Click Breakpoints and verify there is a breakpoint at the PUSH EBP instruction and it is set in main.
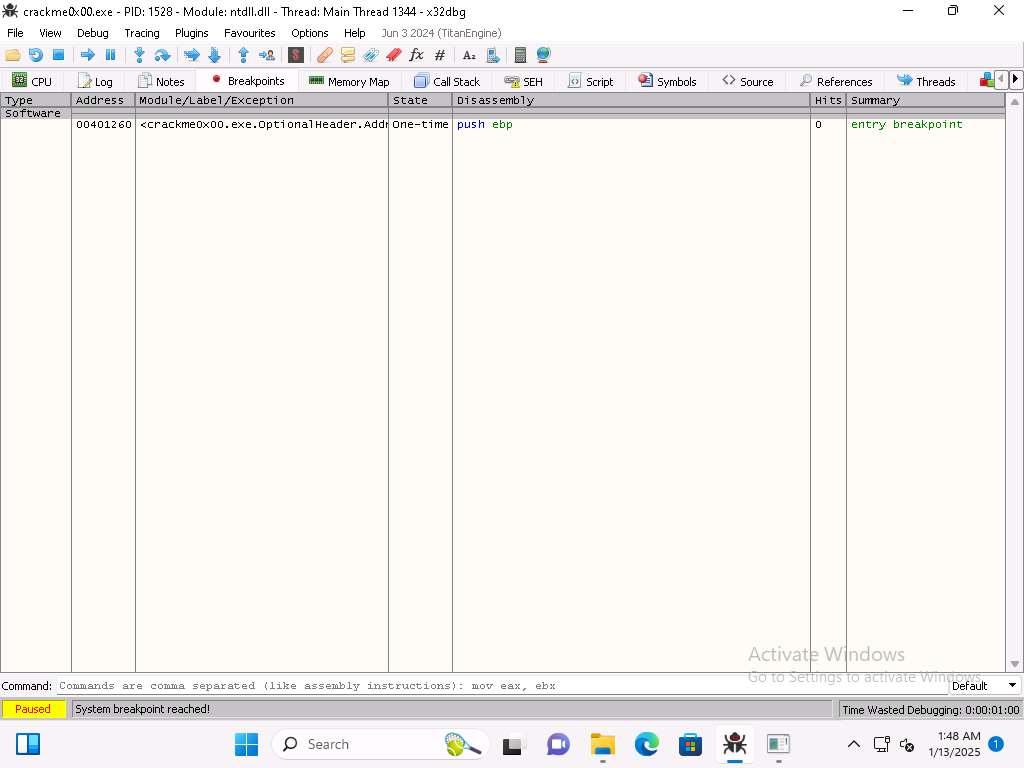
Screenshot Once you have verified the breakpoint click the run (-->) button to run the program. The result of this should be you are at the start of the main function.
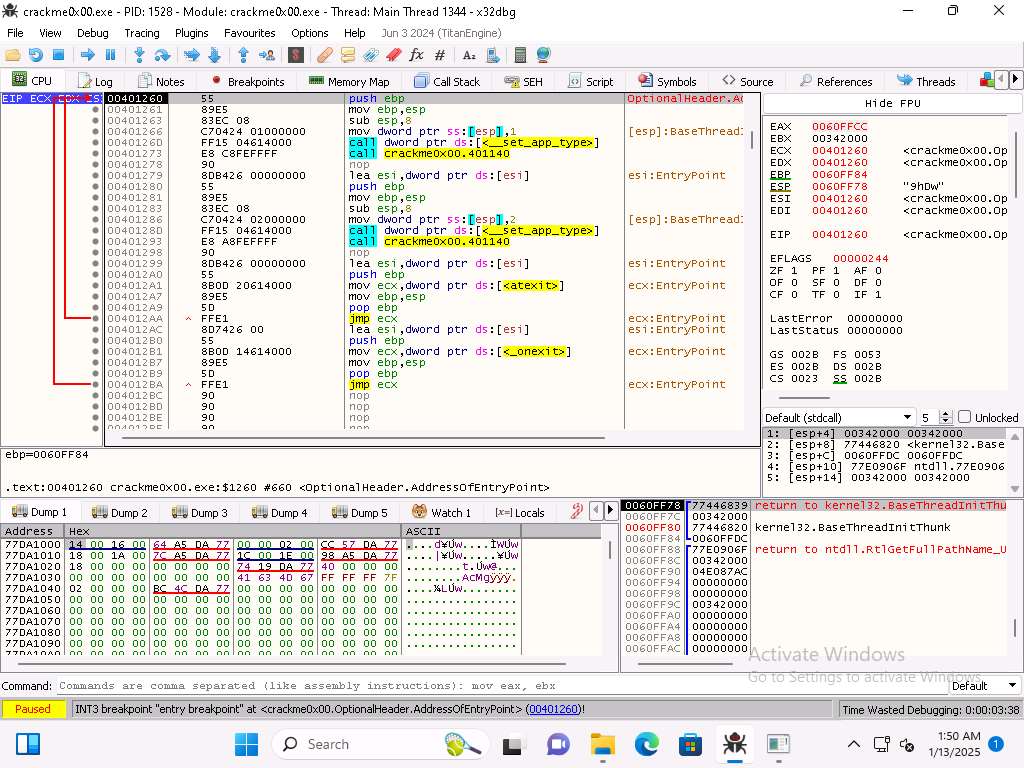
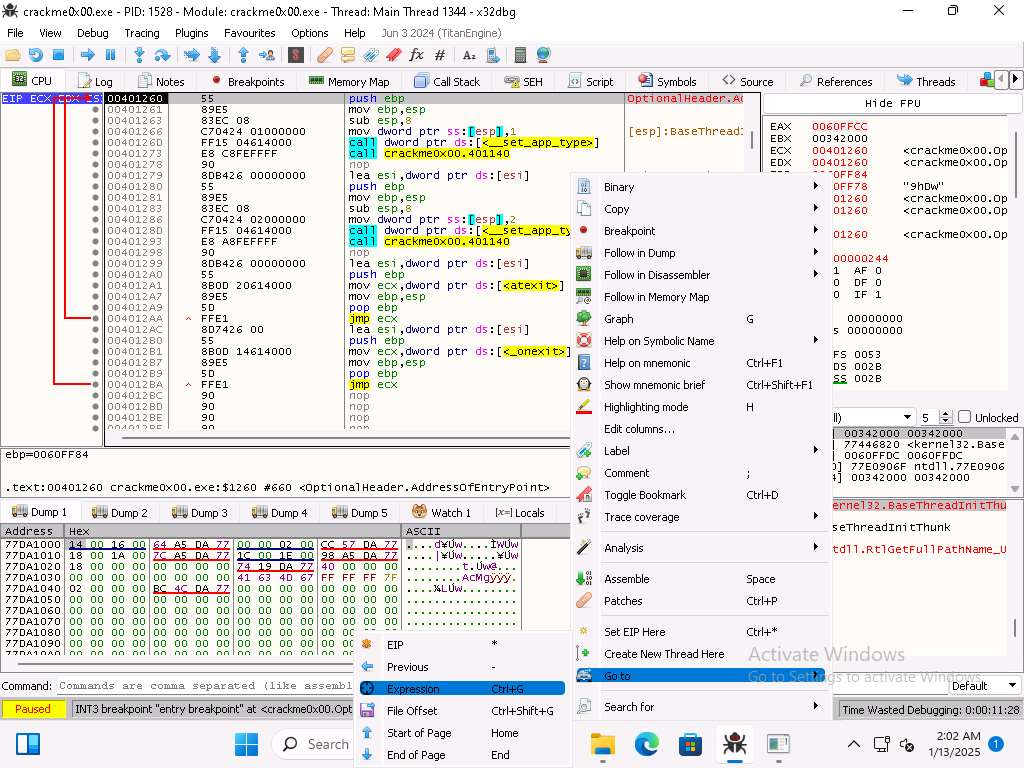
Screenshot You can see the address of the start of main is 00401260
If we look at this address in Ghidra it will not 100% match, from the previous steps we can see that the start address of main is 00401310.
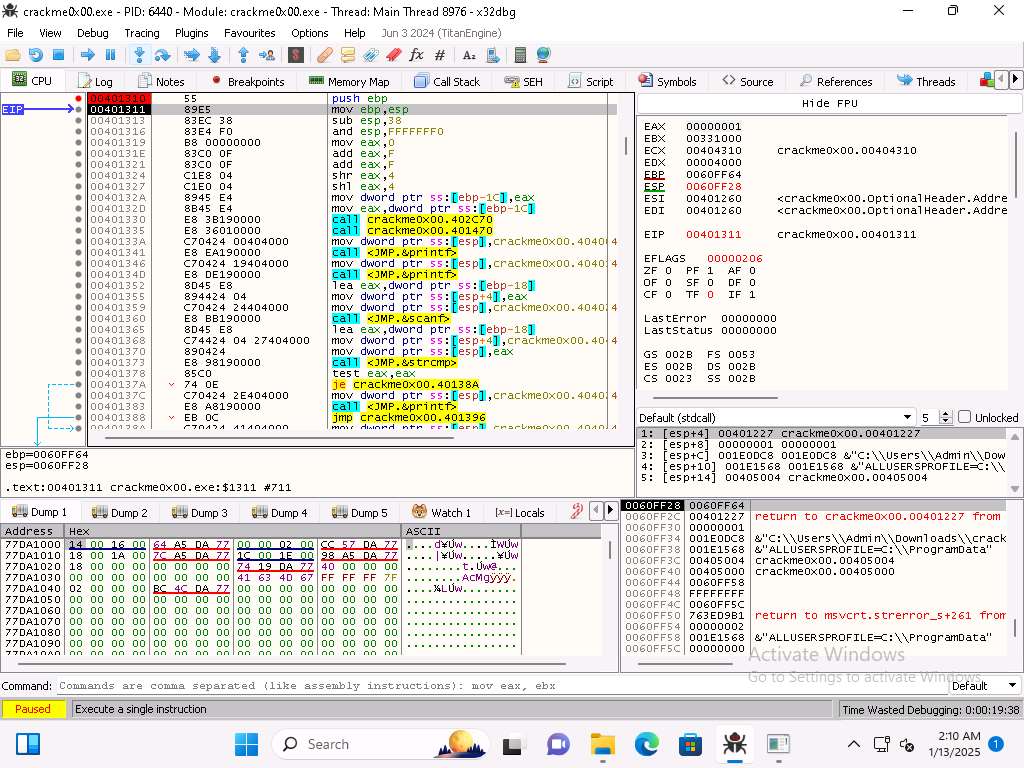
As the image shows, we want to enter address of 00401310 into the right click in the code Go To --> Expression window.
Screenshot 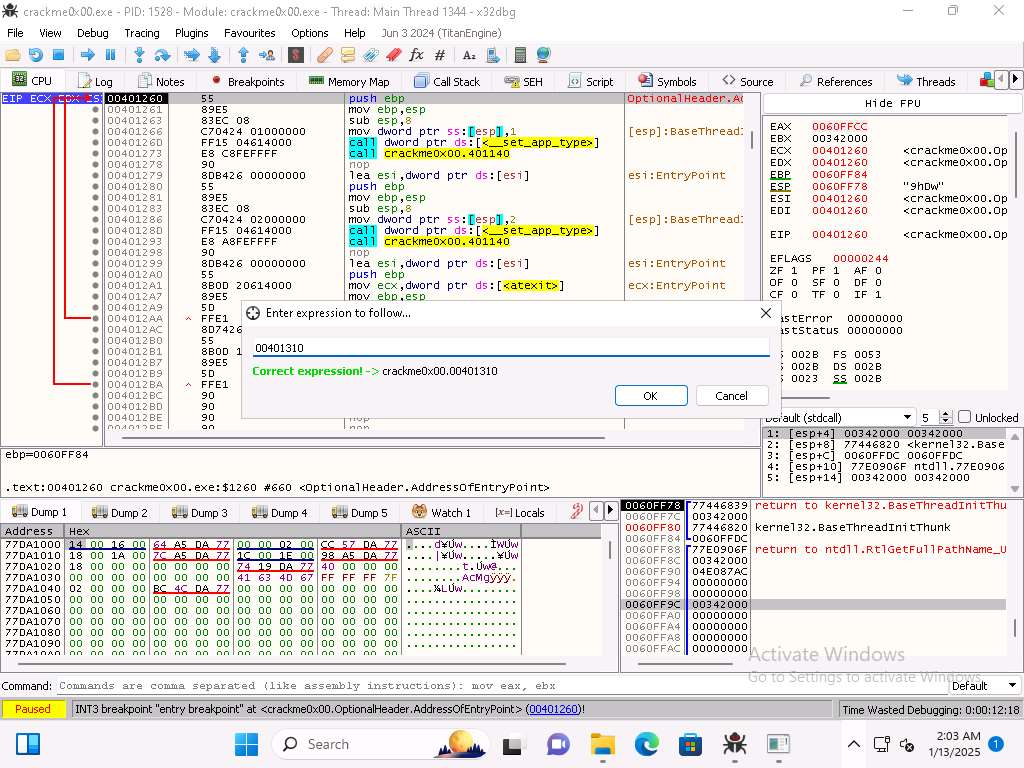
Screenshot Now we have the display that we want. Now set a breakpoint (Toggle) at the start of this function then run the program.
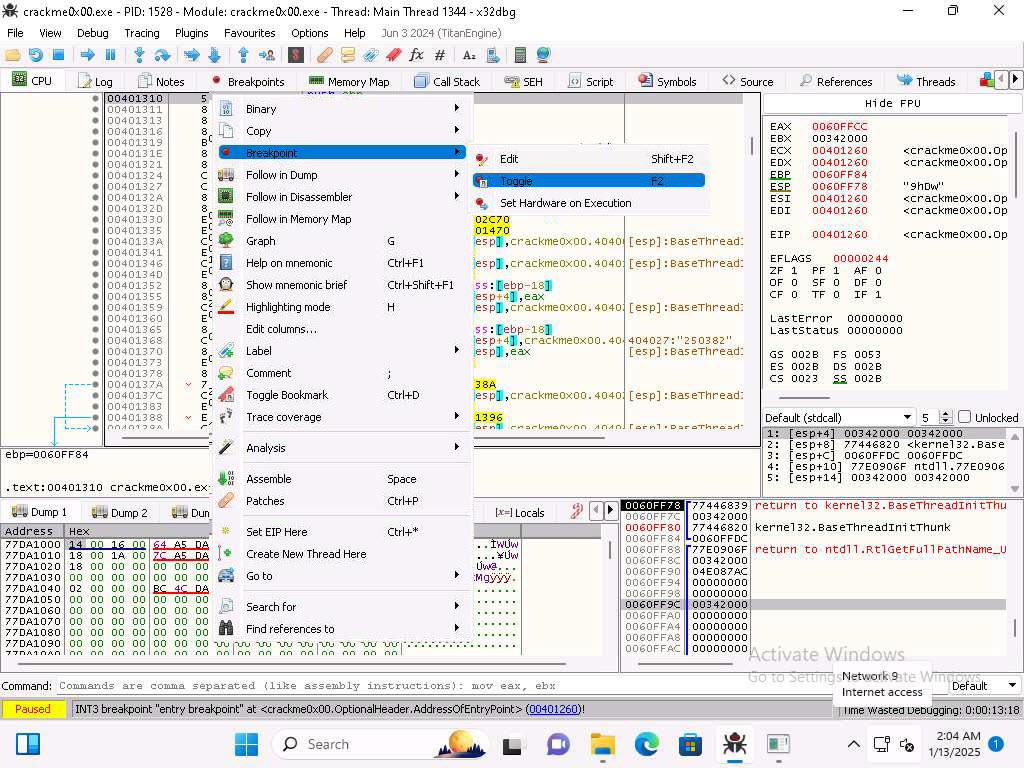
1qsjla1ft.jpg 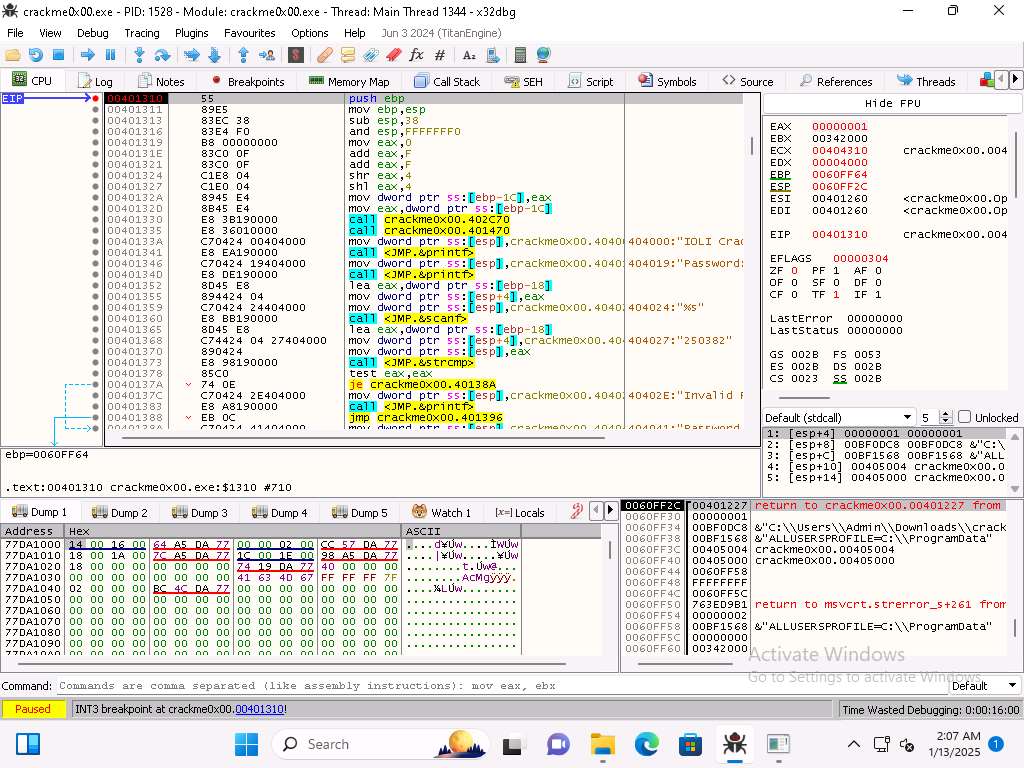
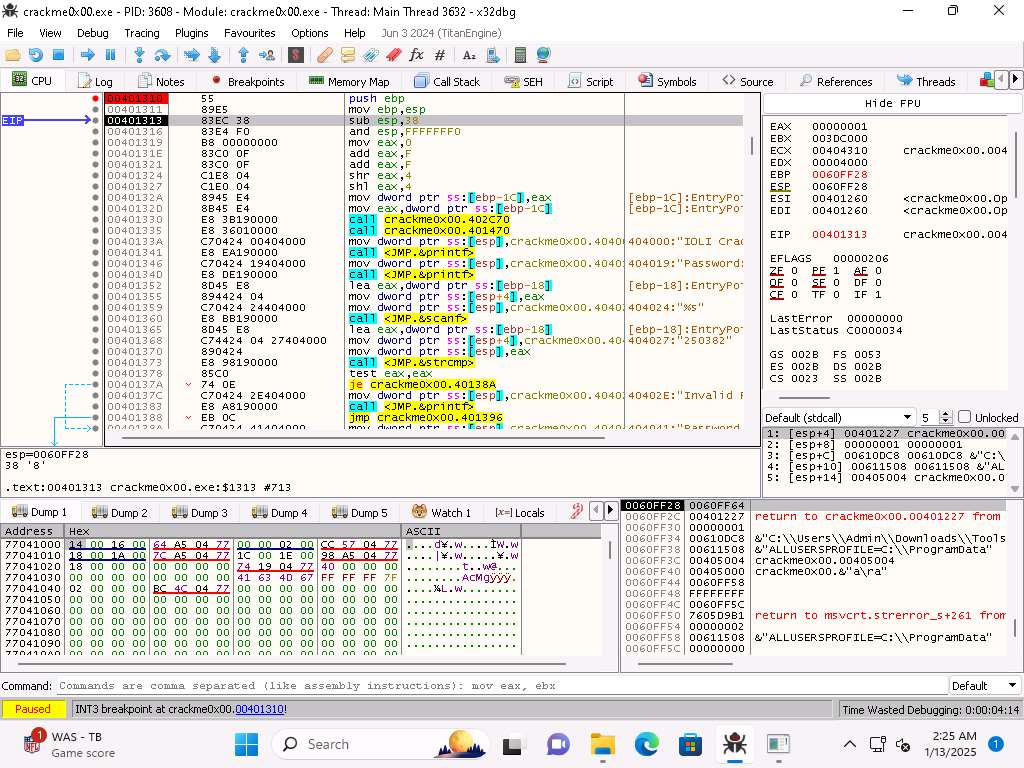
Screenshot Now that we are at the breakpoint we want to step into the code two times.
Screenshot Once we reach the sub instruction we can see that the EBP and ESP have the same values.
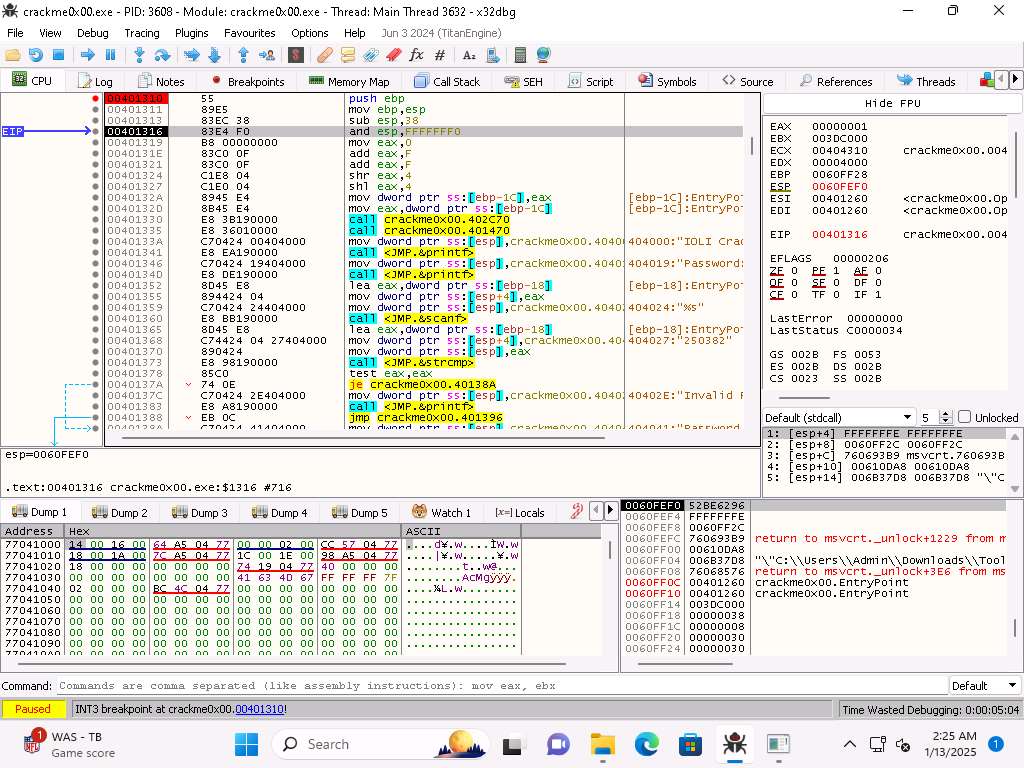
Screenshot The next instruction subtracts the 0x38 and when you step into the next instruction you will see the value change.
Screenshot We can step through the instructions and see the changes in the memory and the registers.
As we step through the code you can see that there is the 2nd call to main by the compiler.
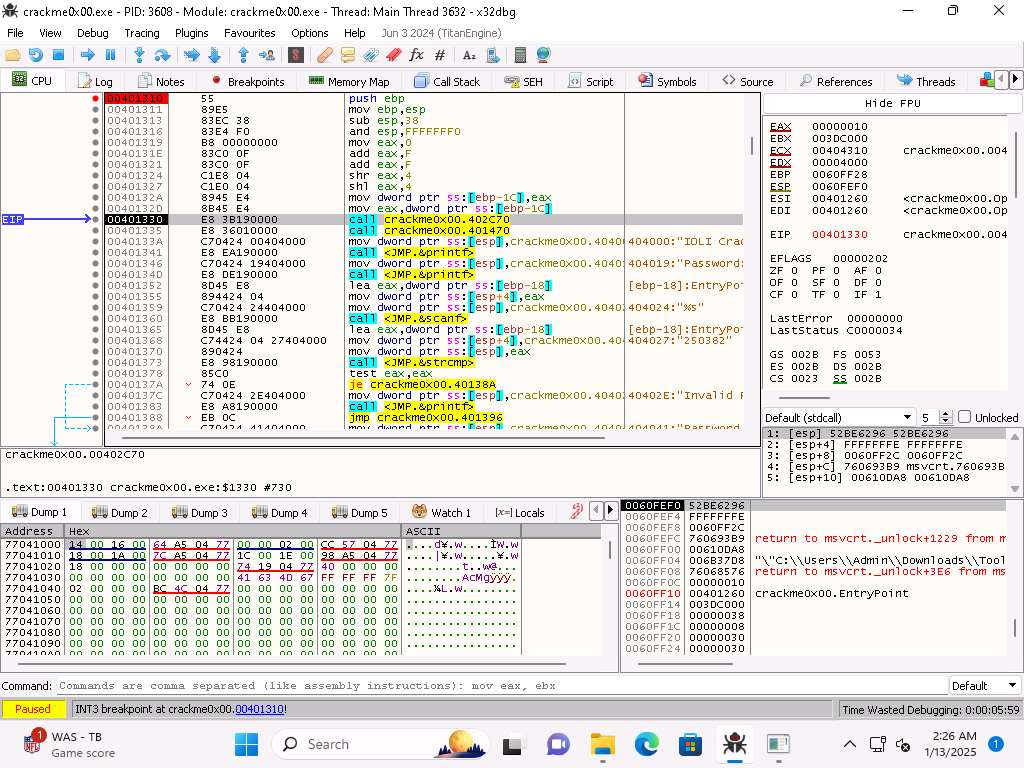
Screenshot It is a good idea to add a comment to that, so you remember that this is something the compiler added, you just right-click it and select comment.
As you continue to step into the code you will see the strings that we identified earlier.
Once you get to where the password is prompted for you can continue to step into the code and analyze it.
Make sure you enter the wrong string to continue to run through the code.
We have accomplished want we wanted to in this lab and will conclude here.
Last updated