
2. Binary Analysis on a 64-bit Linux
Exercise 2: Performing Binary Analysis on a 64-bit Linux
In this lab, we will perform binary analysis on a 64-bit Linux system to understand the structure and functionality of executables. By using tools such as gdb, readelf, and Python, we will analyze binaries to uncover details about system calls, memory addresses, symbols, and program headers. This hands-on exercise demonstrates techniques for reverse-engineering and inspecting ELF files in a 64-bit environment. We will also leverage Python's string manipulation capabilities to format strings for use in assembly and examine system calls through the unistd_64.h header.
Lab Tasks
Login to the Software-Test-Linux machine using studentpassword as Password.
Screenshot In the 64-bit machine, enter the following:
a. gdb -q /bin/bash
b. break main
c. run info registers
The output of this command is shown in the following screenshot.
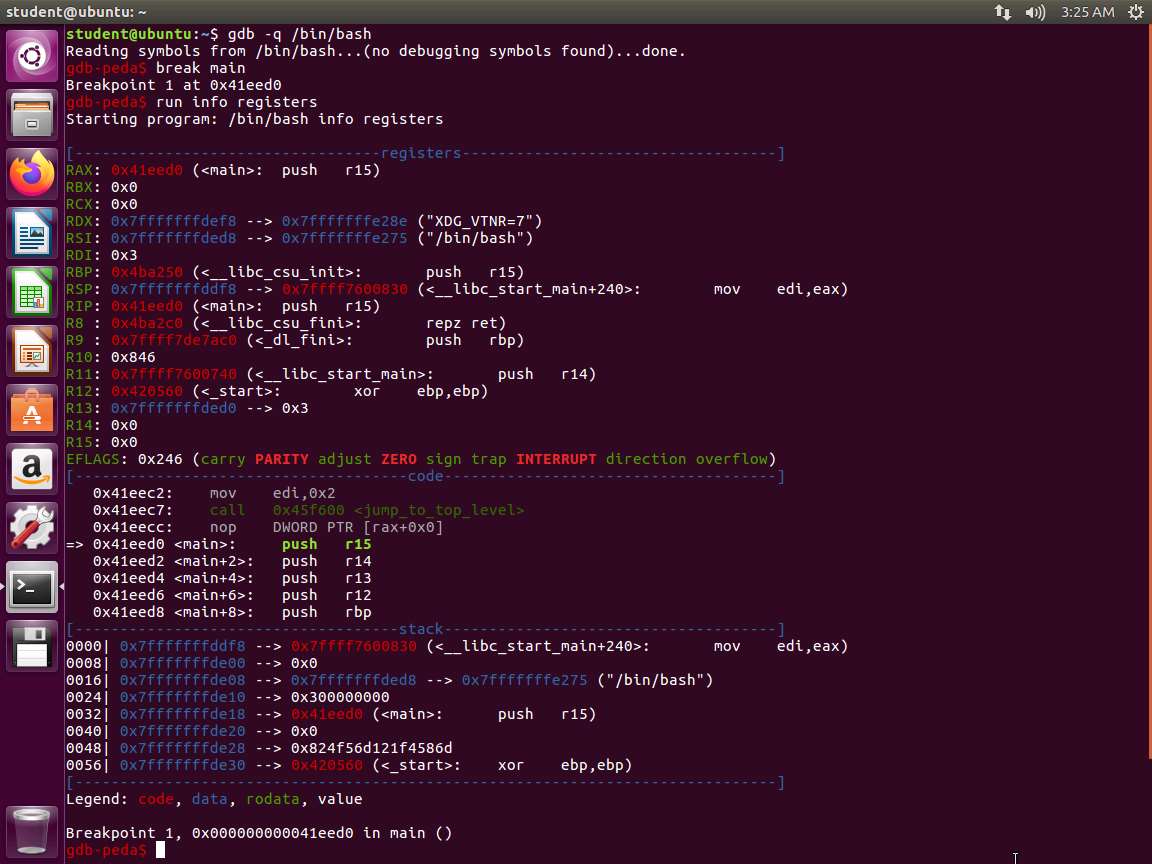
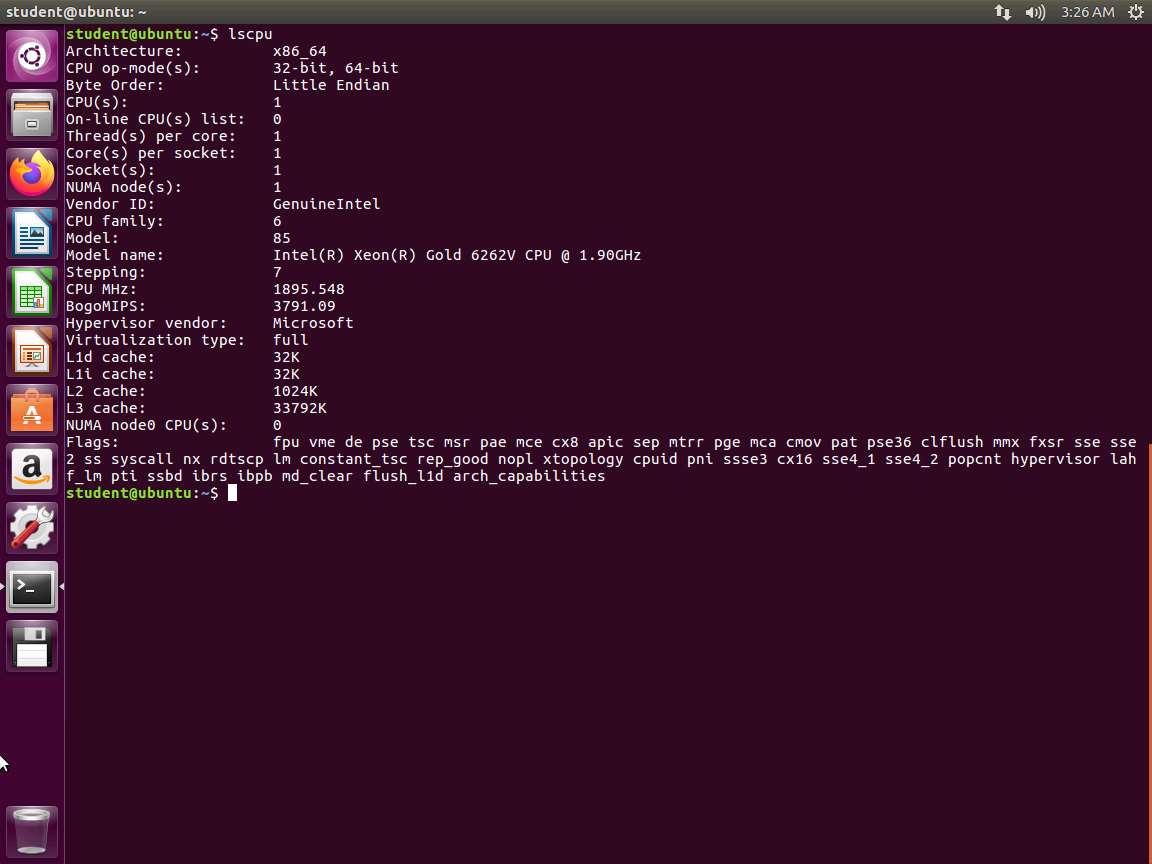
Screenshot As the screenshot in Step 2 shows, we have additional registers along with the 64-bit version of the registers we have already discussed. Next, enter lscpu. The output of this command is shown in the following screenshot.
Screenshot Next, enter cat /usr/include/x86_64-linux-gnu/asm/unistd_64.h.
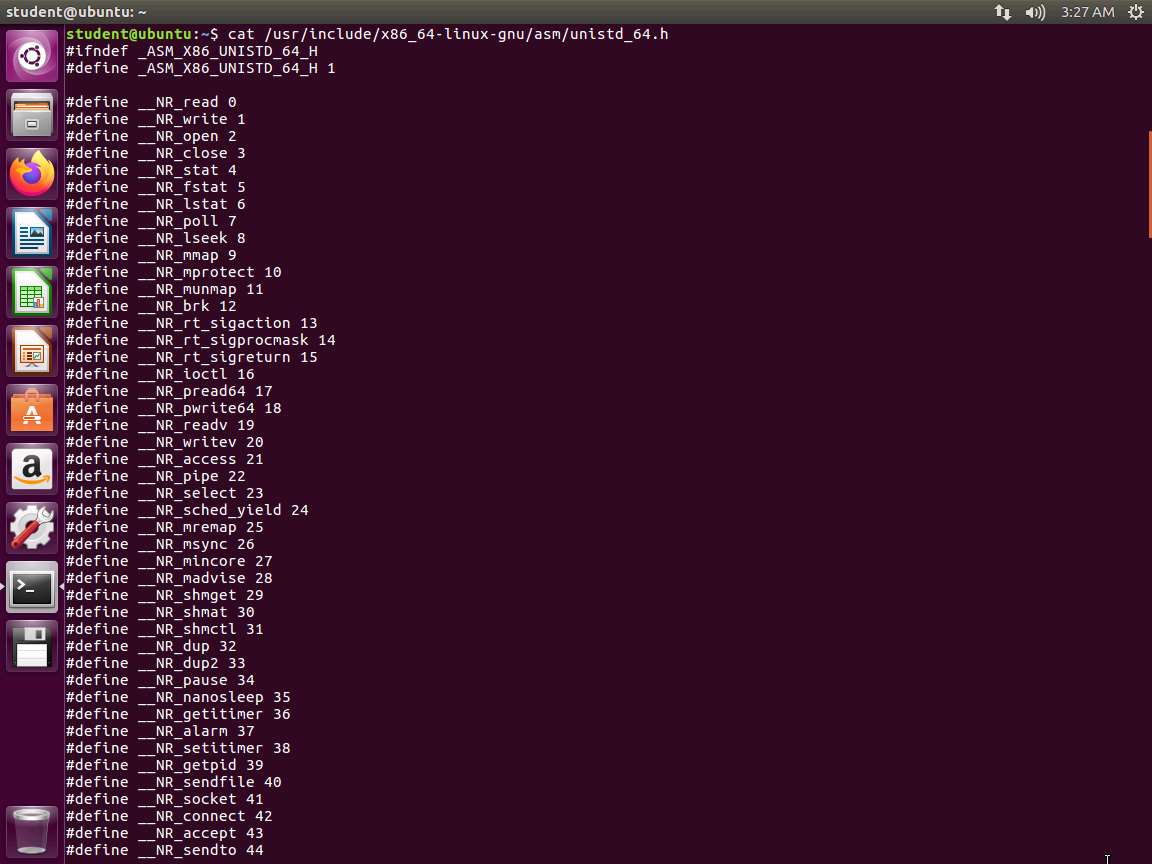
Screenshot 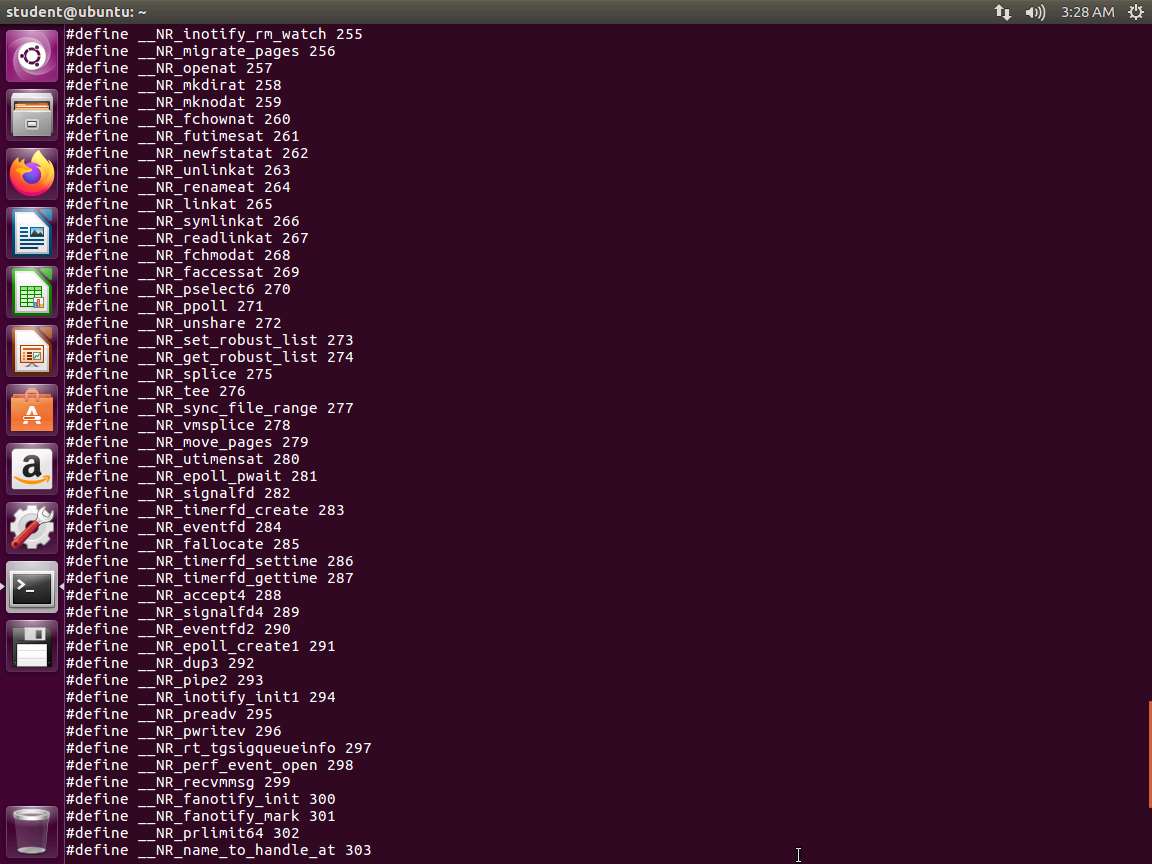
Screenshot As you can see from the above screenshot, we have many more here with the write system call at 1. The exit is at 60.
Next, enter python to enter the python editor.
Screenshot In the editor, enter c = "Hello, World!\n".
Next, enter c[::-1].encode('hex'). The output of the command is shown in the following screenshot.
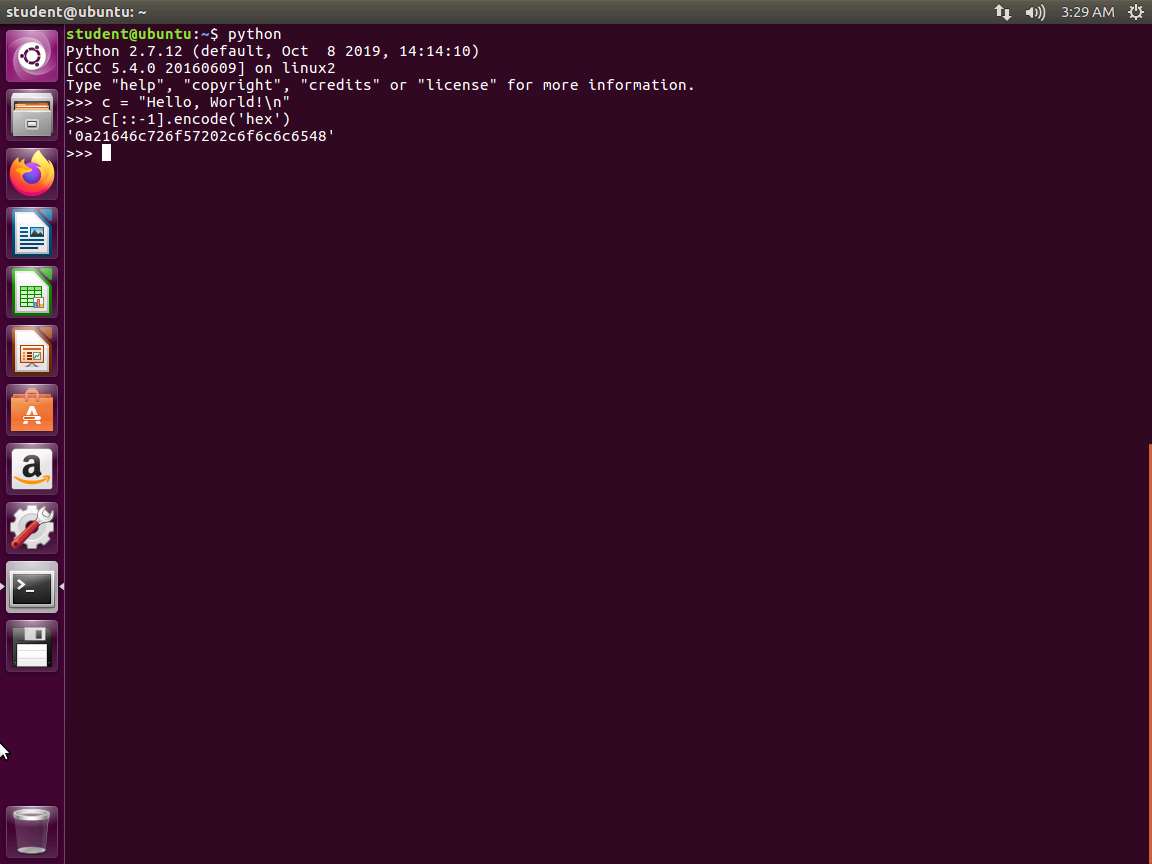
Screenshot Once the Python prompt is available, we initialize a variable called c and store the string as Hello, World!\n. Next, we use Python's power of string manipulation, and in one line, reverse the order of the characters in the string with the c[::-1] syntax. Then, we call the encode method to encode our characters in their hexadecimal representation. This is done with the .encode('hex') part of the syntax. This makes our string almost usable for assembly.
In the terminal window, enter readelf -a -W ~/examples/samplecode/helloworld64-s. The output of this command is shown in the following screenshot.
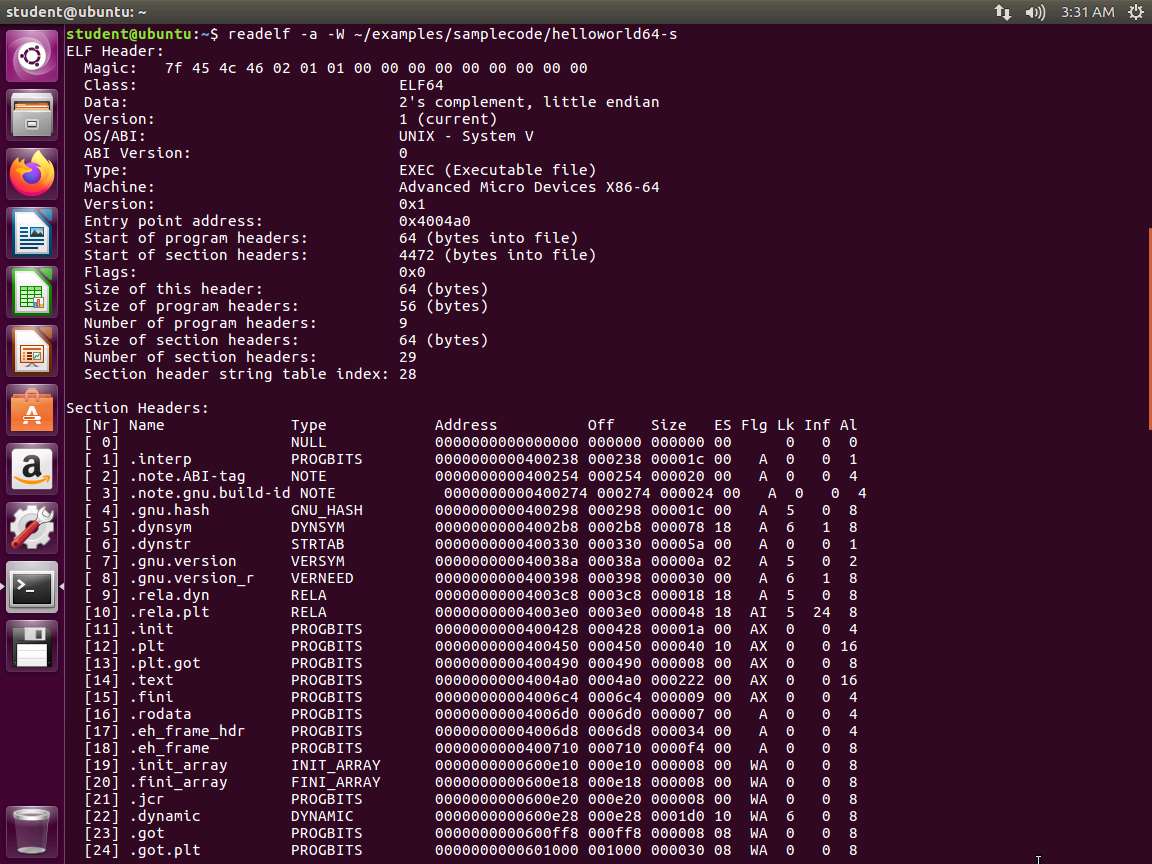
Screenshot The -a argument displays the ELF header, program headers, section headers, symbols, relocations, dynamic section, version information, architecture-specific information, and a histogram of bucket list lengths. We can also see that we are dealing with an executable file as opposed to a relocatable object file and the address in memory where execution begins is 0x400a0. There are nine program headers, each of which is 56 bytes in size, and thirty-one section headers, each of which is 64 bytes in size.
Next, enter readelf -s ~/examples/samplecode/helloworld64-s. The output of the symbol table is shown in the following screenshot.
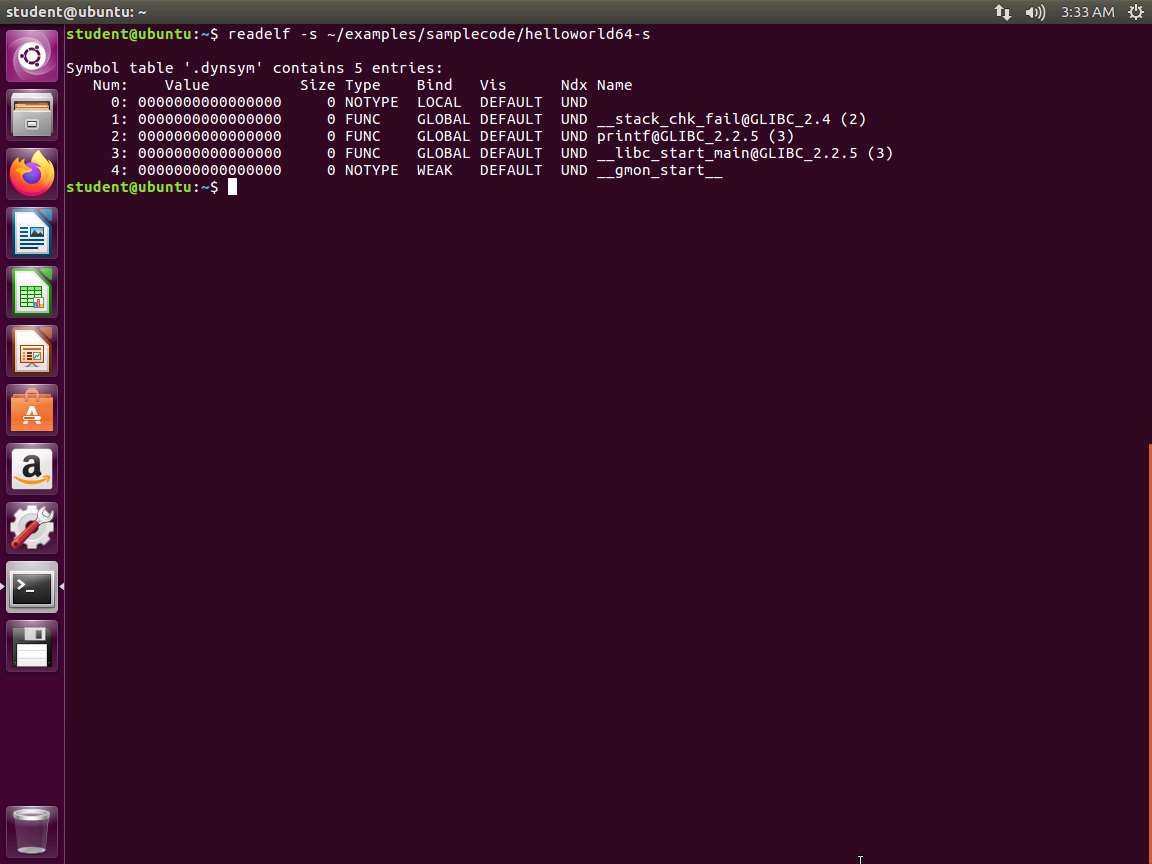
Screenshot What we can gather from this part of the output is that the printf() function is used somewhere in the program. Larger programs with more code and those that use additional functions from shared libraries will have many more functions linked dynamically similar to this. Continuing to review the output, the .symtab section shows us all symbol references in the program, including any variables or function names, and immediately.
The lab objectives have been achieved. Close all windows and clean up from the exercise as required.
Last updated