
12. Identifying and Debugging Stack Buffer Overflows Using Address Sanitizer
Exercise 13: Identifying and Debugging Stack Buffer Overflows Using Address Sanitizer
In this lab, we will explore the process of using the tool such as Address Sanitizer that will provide us more capabilities.
Lab Tasks
Log in to the Ub20 Fuzzing machine using studentpassword as Password.
The first thing we need to do is create a simple main function. Enter the following into your favorite editor, and save it as test.c.
TypeCopyint main()   {
        int a[2] = {1,0};
        int b=a[2];
    }
As a reminder, this is a classic off-by-one-error. An array "a" with two elements is defined. The elements of an array are accessed with indices starting with 0, so this array consists of the elements a[0] and a[1]. The code then sets b to the value a[2]. However, a[2] is an invalid value, as it is not part of the array. The variable b will end up containing an arbitrary value. It just reads "some" memory from the stack, and it is undefined what that memory contains. However, unlike other memory access bugs, this does not crash. Even valgrind will not be able to indicate that something is wrong
Recent versions of the compilers llvm and gcc have received a powerful tool to spot such memory access bugs, which is Address Sanitizer. We can enable it at compile time. To use Address Sanitizer, we need to add the parameter -fsanitize=address to our compiler flags. To make debugging easier, we will also add -ggdb.
In the terminal window, type gcc -fsanitize=address -ggdb -o test test.c and press Enter.
Now that the code has been compiled with Address Sanitizer, we obtain more feedback when it is run. Type ./test and press Enter. An example of the command output is shown in the following screenshot.
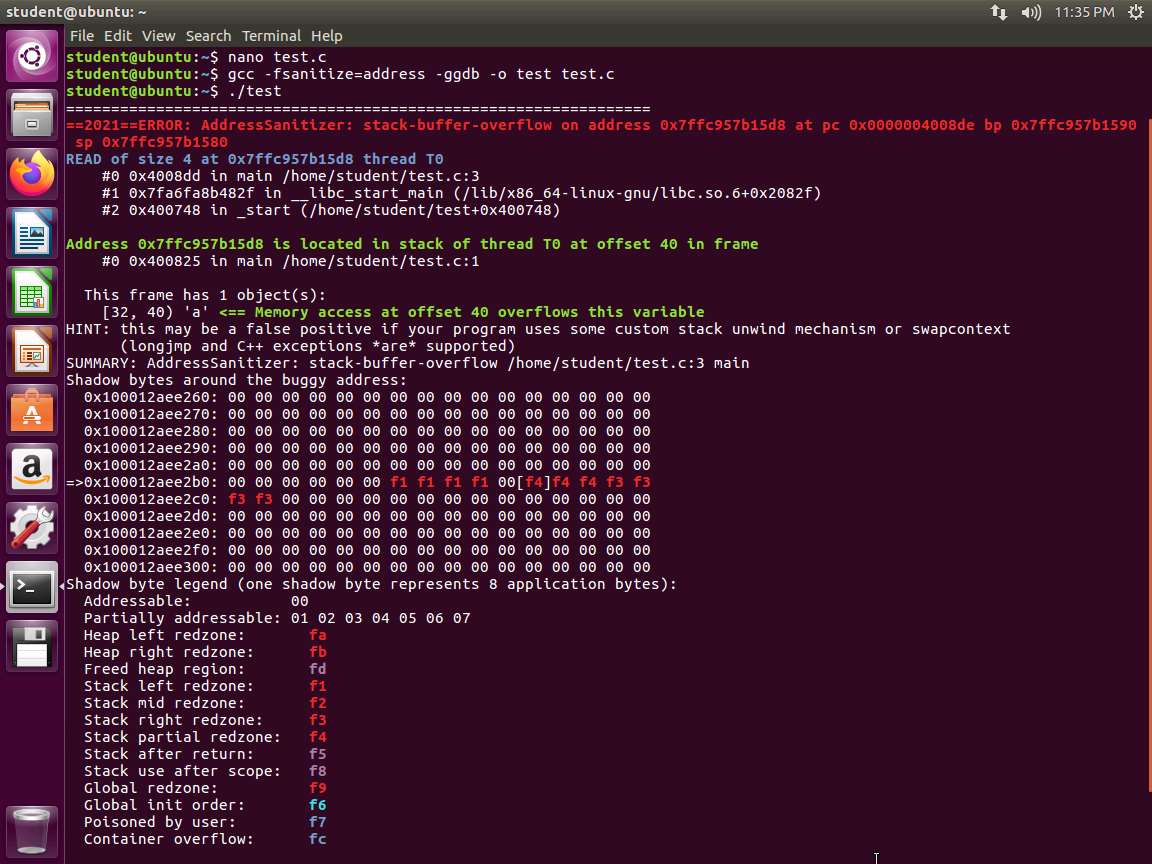
Screenshot The tool is reporting that we have a stack-buffer-overflow as shown in the following screenshot. It even references the line with the problem.
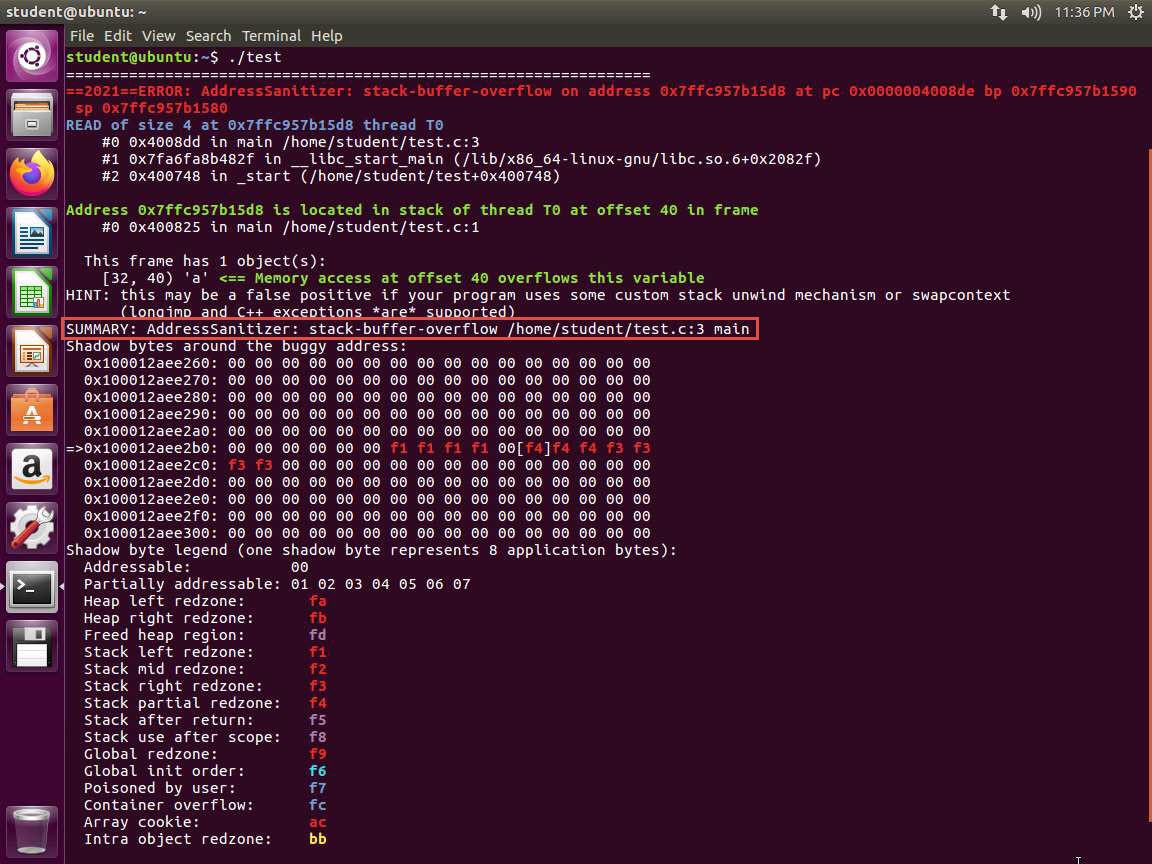
7.jpg The software we want to fuzz usually does not come as a simple .c file, so we have to add the Address Sanitizer to the compiler flags. For a software using normal configure scripts, this can be performed using the following commands:
a. ./configure --disable-shared CFLAGS="-fsanitize=address -ggdb" CXXFLAGS="-fsanitize=address -ggdb" LDFLAGS="-fsanitize=address"
b. make
Again, we add -ggdb for more debugging information. If possible, we disable shared libraries and set the flags for both the C and the C++ compiler.
We can now run our software against malformed inputs similar to how we did in the previous lab.
When redirecting the output to a log file, we must consider that we cannot grep for Segmentation Fault anymore. Instead, we need to grep for Address Sanitizer's messages using grep AddressSanitizer fuzzing.log
Note the following when using Address Sanitizer. If it finds a memory access violation, it does not automatically crash the application. This is a problem when using automated fuzzing tools because they usually try to detect segfaults by checking the return code. We can, however, force the tool to crash the software when an error occurs. To do this, we use the environment variable ASAN_OPTIONS by entering export ASAN_OPTIONS='abort_on_error=1'.
Another problem is that the tool can take a large amount of memory.
A fuzzed sample may cause an application to allocate vast amounts of memory, which in turn may cause your system to become unstable and other applications to crash. Therefore, do not do anything important on a system while running a fuzzer without a memory limit on the same system.
As you have seen, you can do several things with this tool. Remember that it is only one suite of sanitizers. As such, you are encouraged to explore this tool as well as others.
The lab objectives have been achieved.
Last updated