
3. Binary Analysis Methodology
Exercise 3: Exploring Binary Analysis Methodology
In this lab, we will explore the methodology of binary analysis by identifying, examining, and analyzing executable files in a Linux environment. This exercise demonstrates techniques for discovering executables on the system, gathering information about binary files, and understanding their structure and functionality. By using commands like find, file, and strings, we will gain insights into the binaries and uncover details such as architecture, hardcoded data, and potential vulnerabilities.
Lab Tasks
Login to the Software-Test-Linux machine using studentpassword as Password.
Launch a terminal window and enter sudo -i.
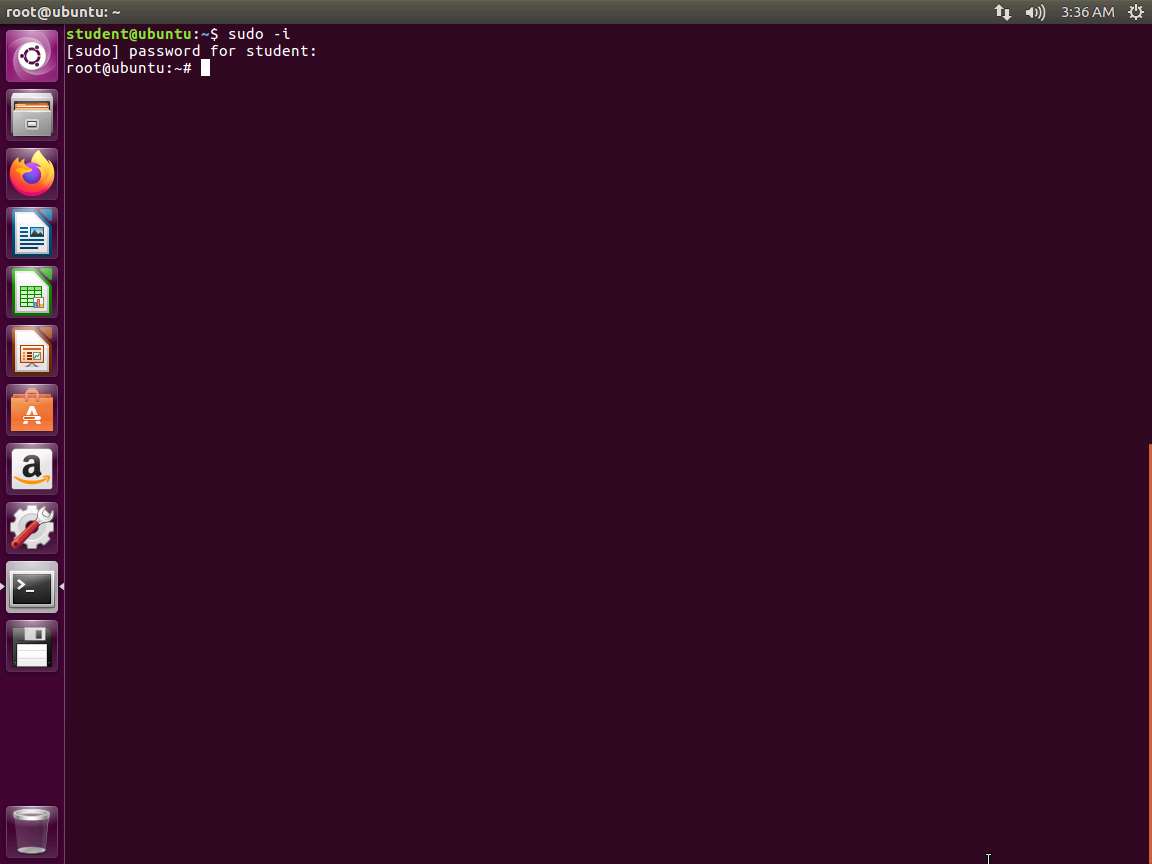
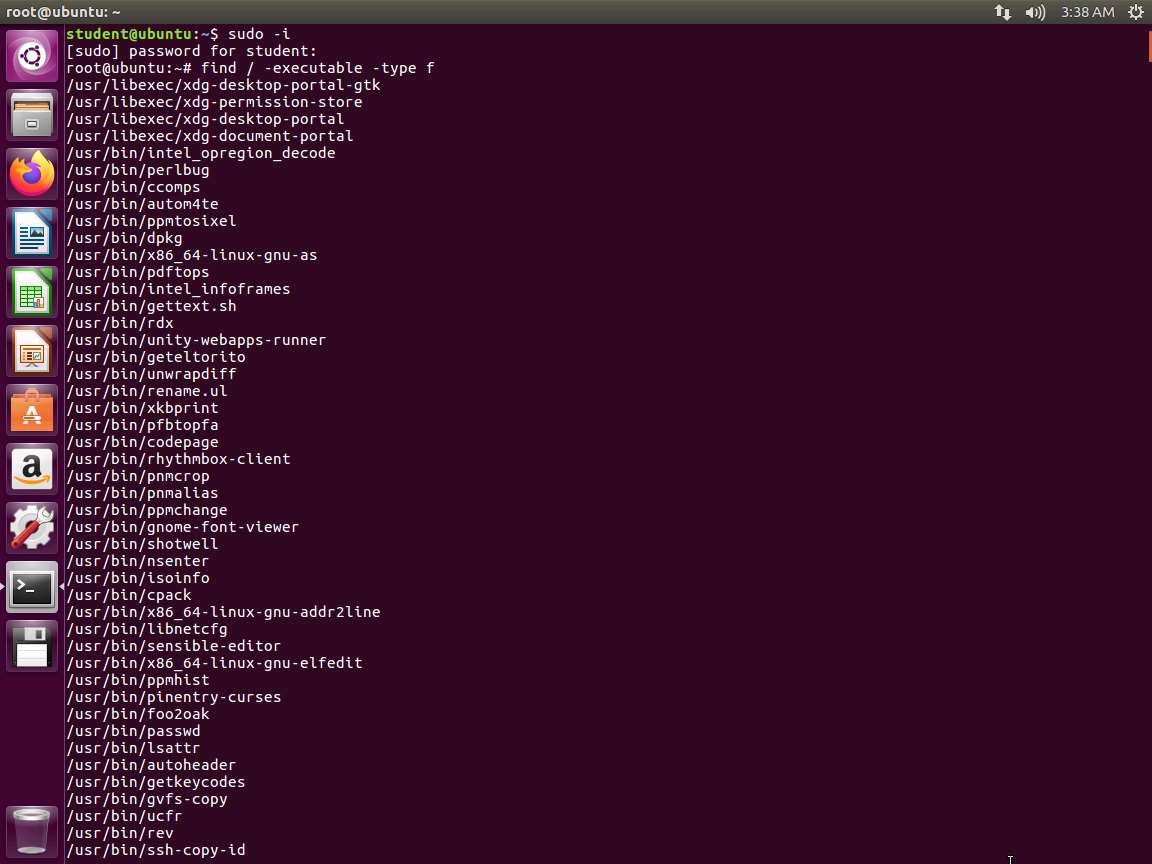
Screenshot The first step is discovery. In the terminal window, enter find / -executable -type f. The output of the command will display a long list of programs, but we wanted to cover the step, since we are doing binary analysis and need to find executable files.
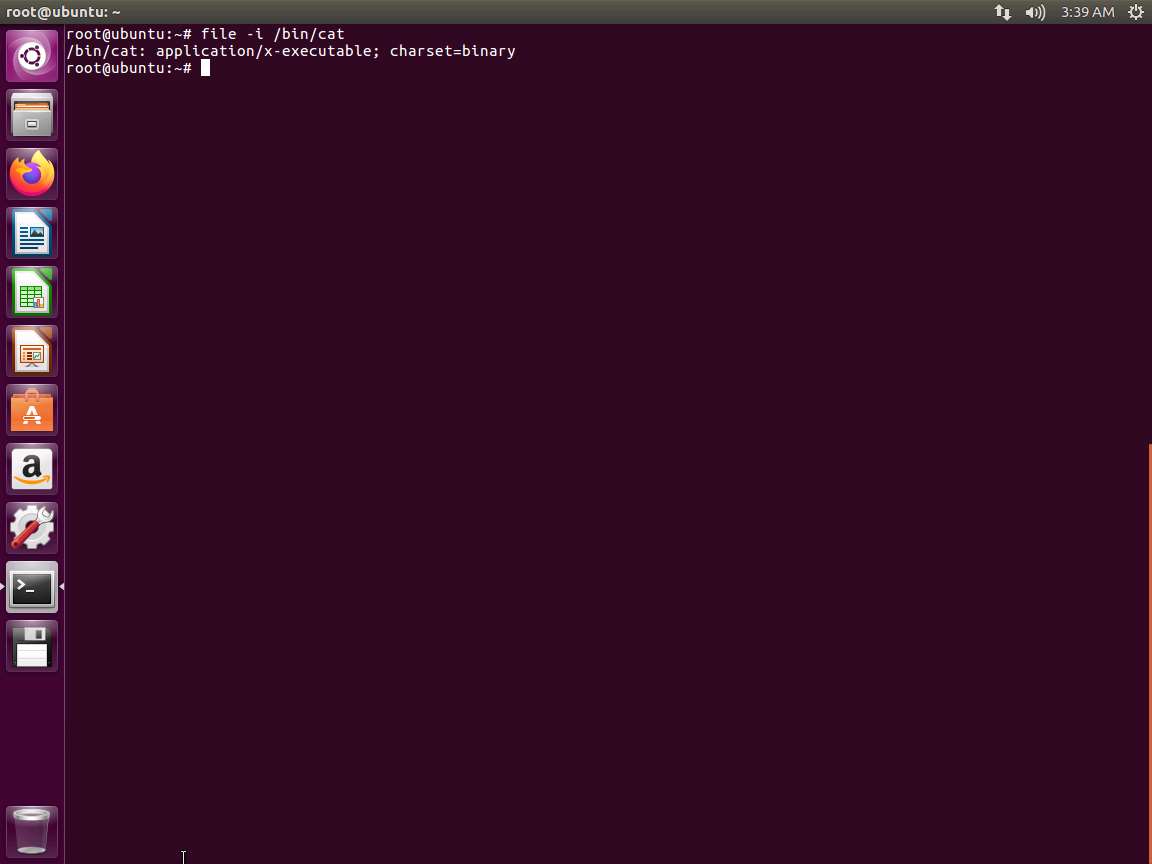
Screenshot Next, in the terminal, enter file -i /bin/cat. The output of the command is shown in the following screenshot.
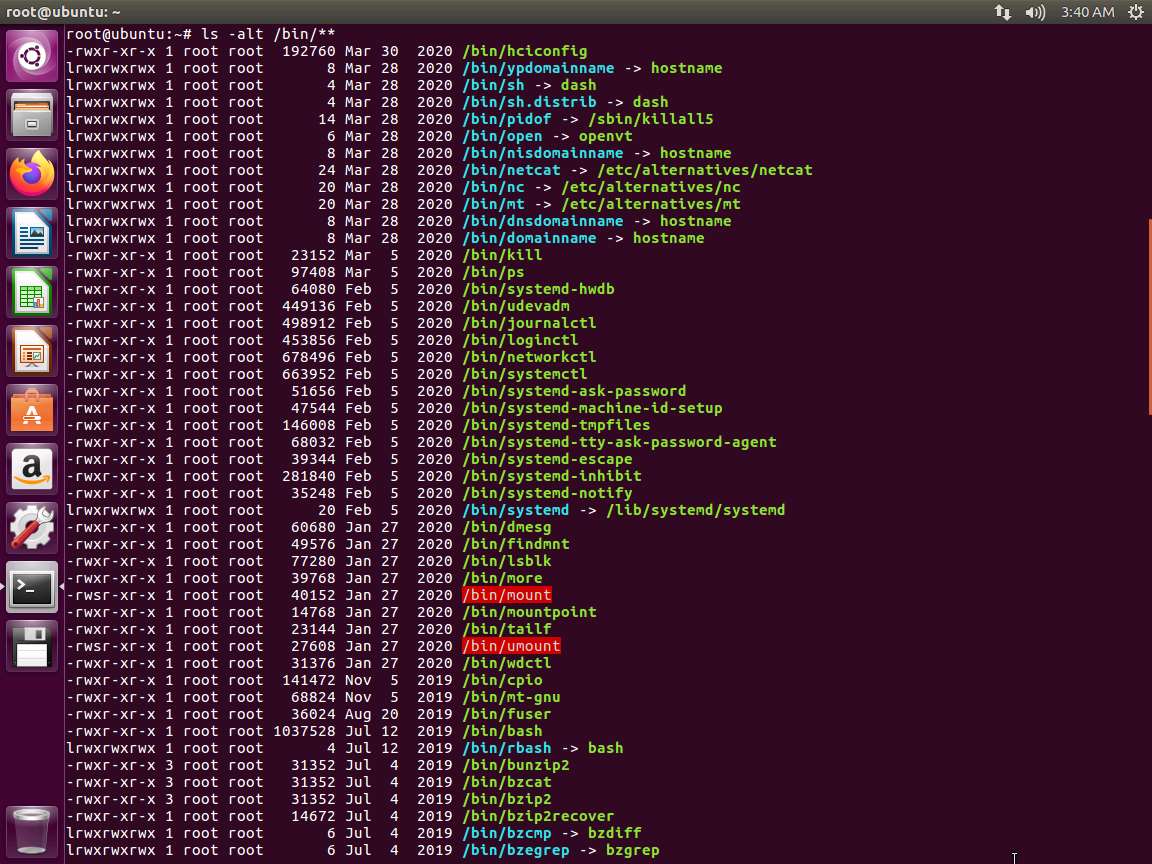
Screenshot Next, enter ls -alt /bin/. The output of the command is shown in the following screenshot.
Screenshot The -i argument is used to look at the /bin/cat binary and to show the results as strings for the mime type and mime encoding of the binary itself. Note the application/x-executable; charset=binary portion of the output.
Next, in the terminal window, enter updatedb; locate 'cat'. The output of this command is shown in the following screenshot.
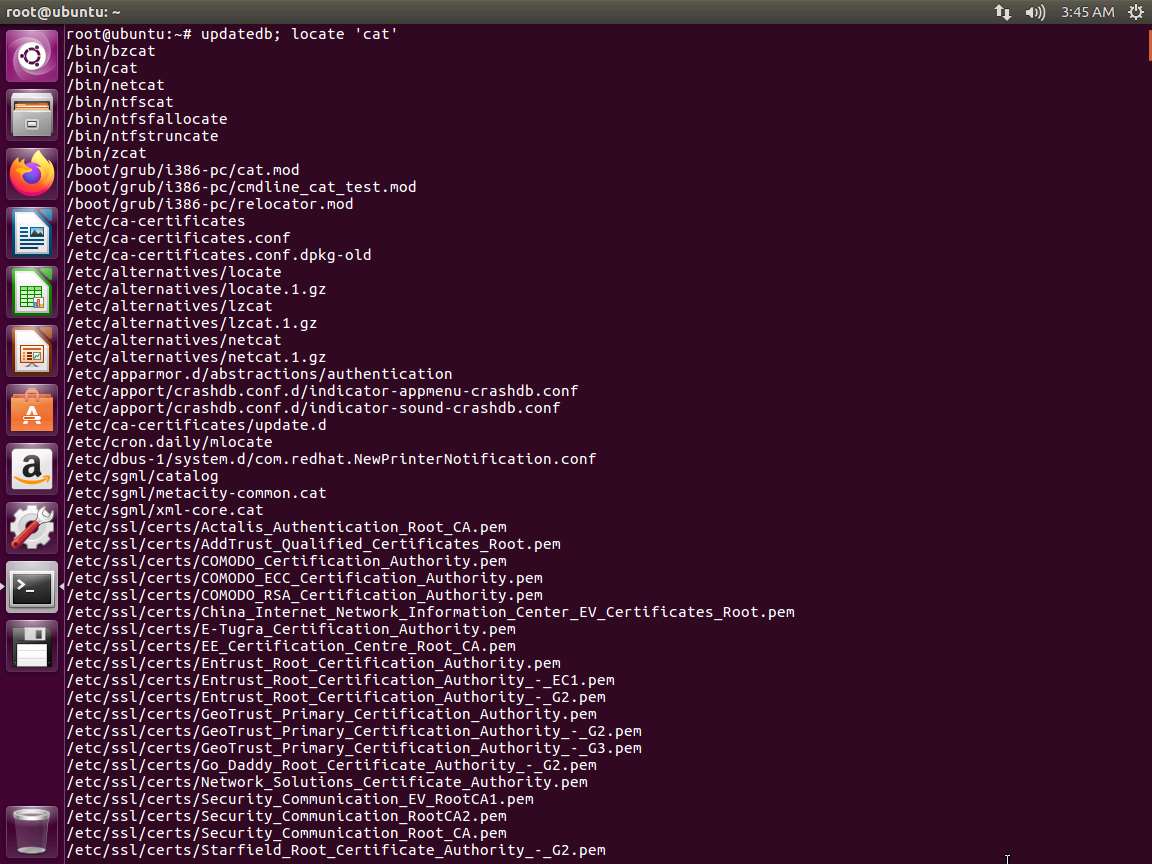
Screenshot The command is used to update a database for the mlocate tool. We then use the locate command to hunt down any file with the word cat in the name. These tools together make it fairly easy to track down binaries written to disk once we have the name of the binary. For example, as a result of reviewing the running processes on the host.
In the terminal window, enter ps -ef. An example of the command output is shown in the following screenshot.
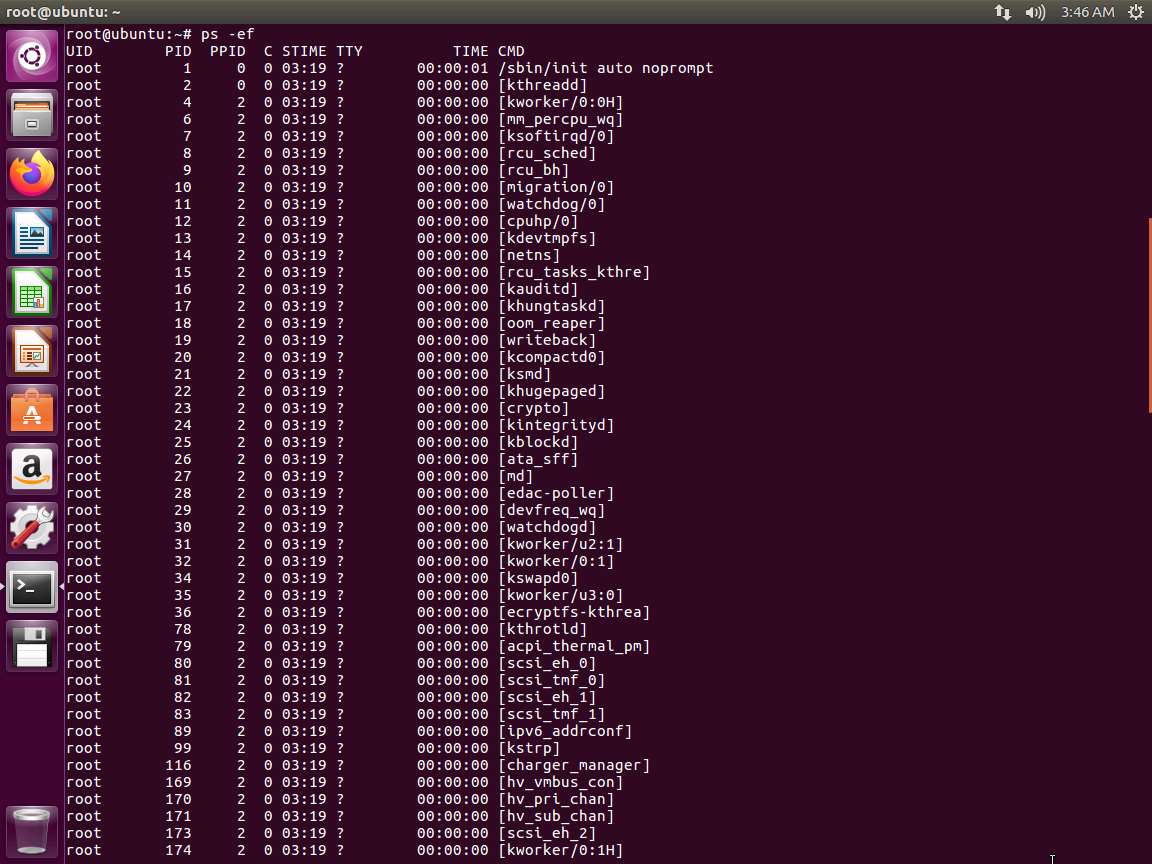
Screenshot This command displays all running processes by all users of the system, using the full format for displaying the output.
In the terminal window, enter for i in $(find / -executable -type f);do file -i $i | grep -i 'x-executable; charset=binary';done. An example of the output is shown in the following screenshot.
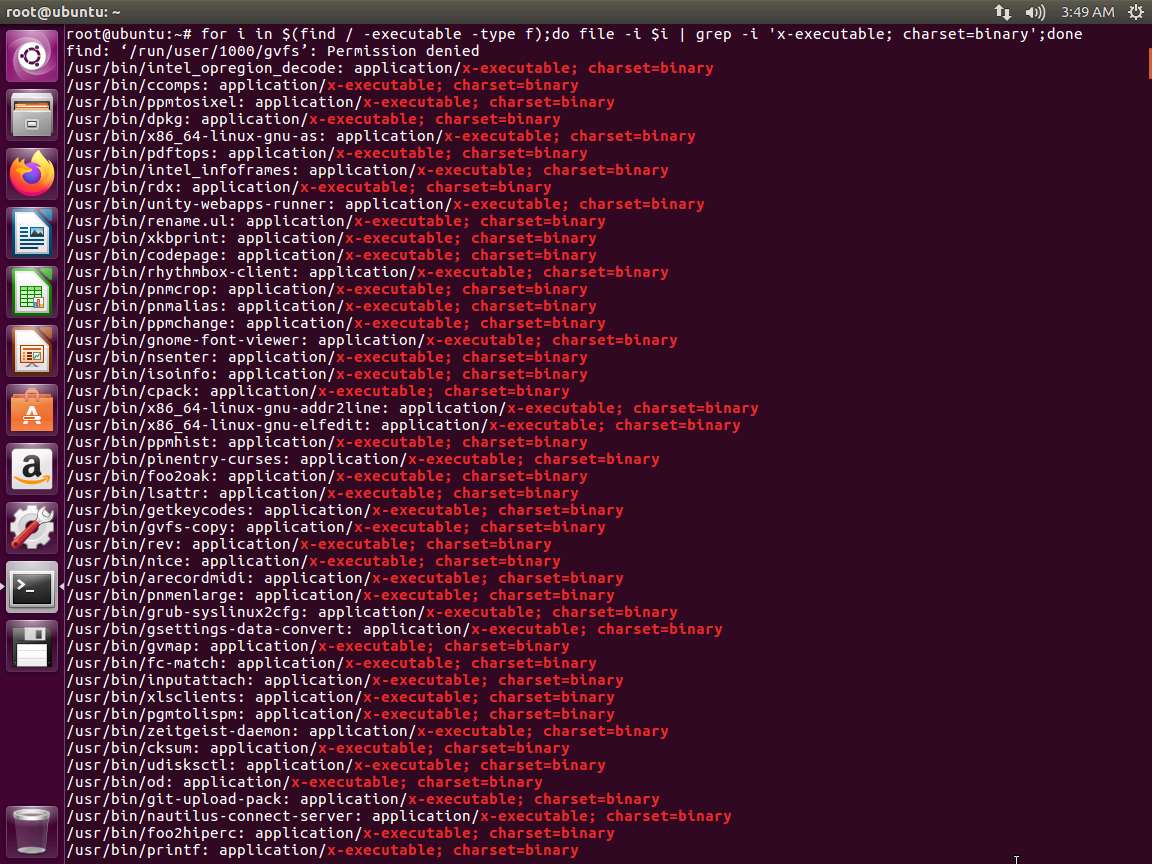
Screenshot This command shows for every line in the output of our find command, run the file command and grep the output to only display executable binary files.
We are now ready for the information gathering step. Launch a new terminal window, enter file ~/examples/samplecode/info. The output of the command is shown in the following screenshot.
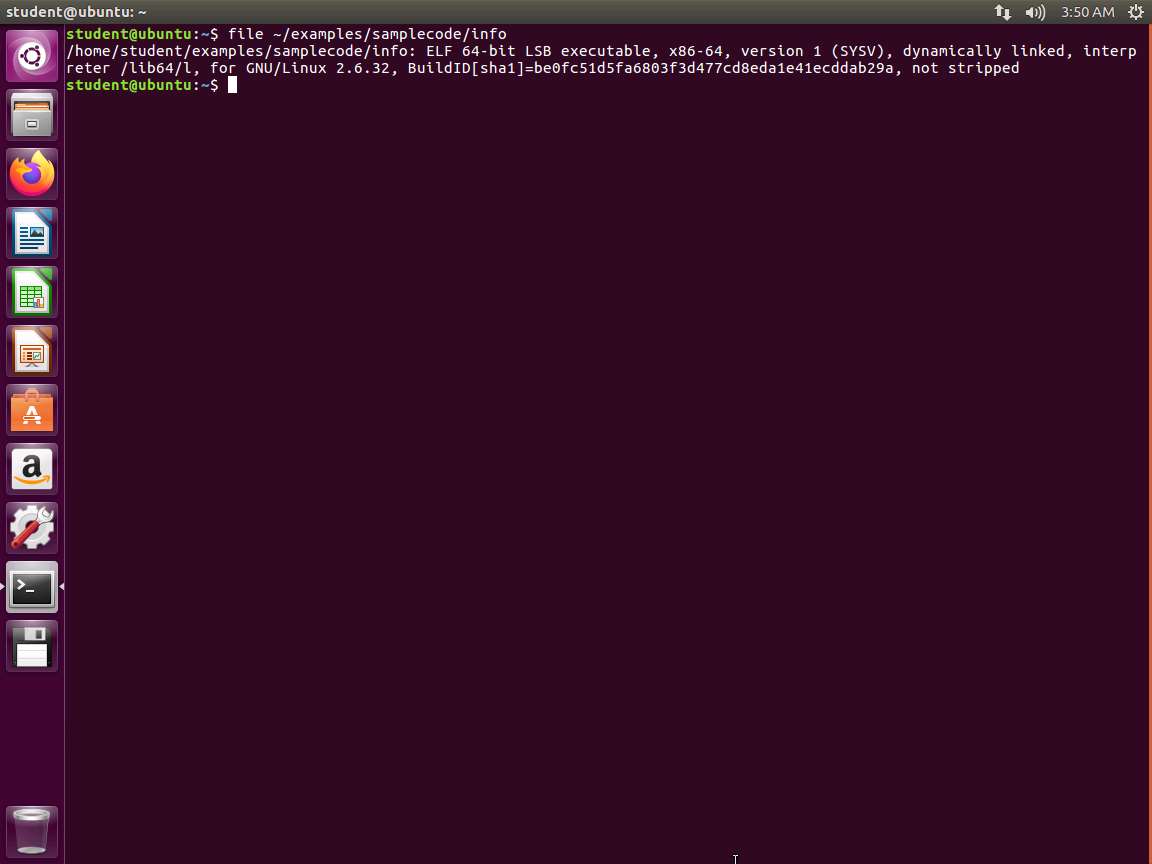
Screenshot We can see that this is a 64-bit executable and linking format (ELF) formatted executable binary that contains its symbol table (because it is not stripped in our output). The file command is a great way to start because it gives us quick yet detailed information about the format of the binary and other pertinent information such as the architecture, whether we are dealing with an executable or a relocatable object file, the binary hash, and whether or not the binary has been stripped of its symbol table or not. The output of the file command is largely dependent upon the options used when the binary was compiled.
Next, in the terminal window, enter strings ~/examples/samplecode/info. The output of the command is shown in the following screenshot.
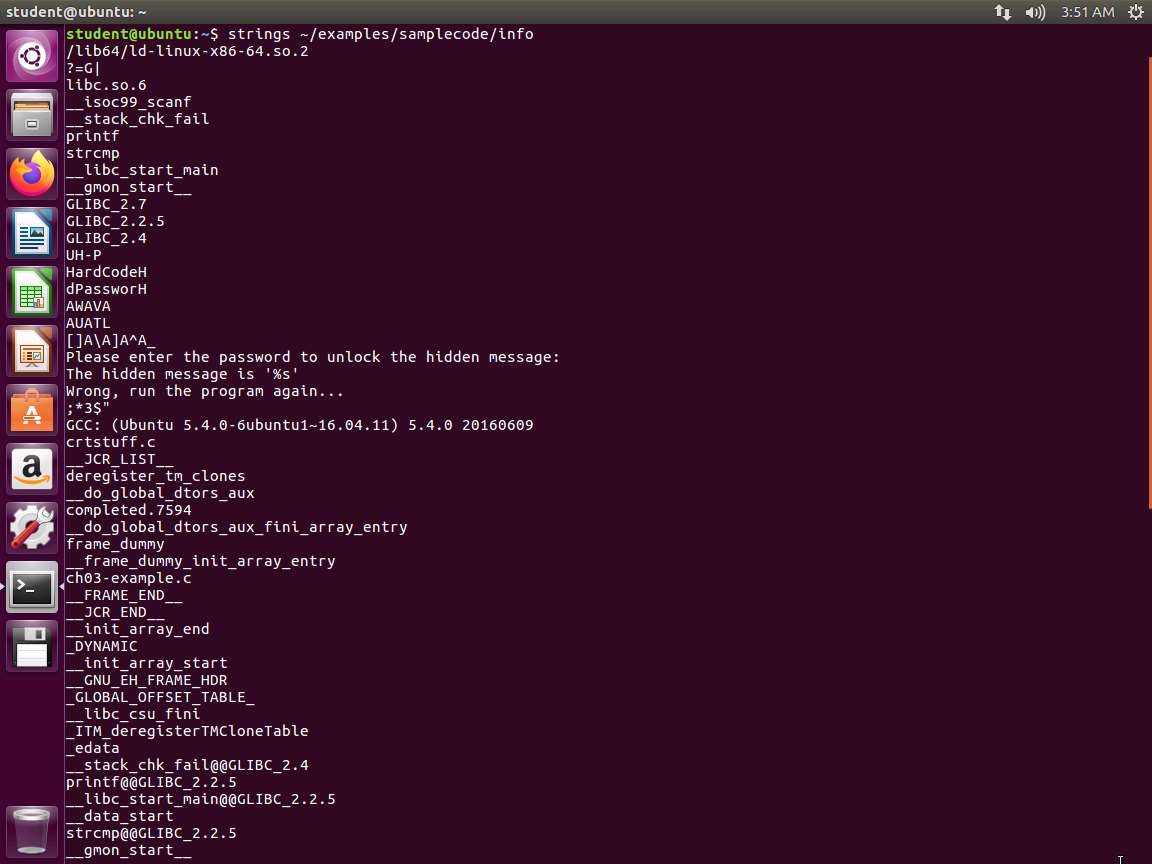
Screenshot This output reveals what appears to be a hardcoded password, a message requesting a password, a sentence using the C-style %s format string, and what appears to be a failure message if the password is incorrect.
You will also notice the use of scanf, printf, and strcmp near the beginning of the output. For those familiar with C programming, printf is used to display output to stdout, scanf is used to take input from stdin, and strcmp is used to compare two strings. Therefore, what this tells us is that this program uses these functions in some way. Based on the hardcoded password and the sentence requesting the password, you could make some assumptions about the program; however, it is much safer to be certain than to assume anything from the output.
Next, we will return to our readelf command. Enter readelf -h ~/examples/samplecode/info.
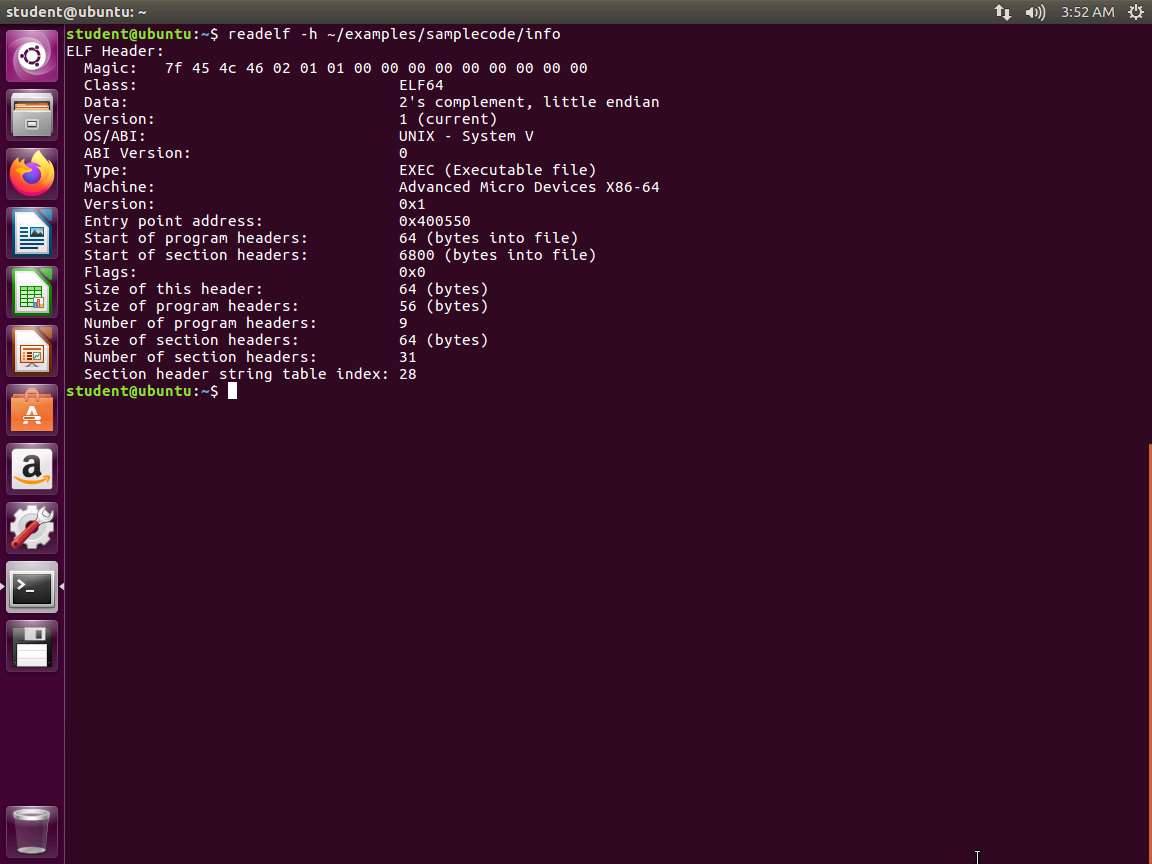
Screenshot The readelf tool is invaluable in our quest for gathering information about a binary.
Next, enter readelf -l -W ~/examples/samplecode/info. The output of the command is shown in the following screenshot.
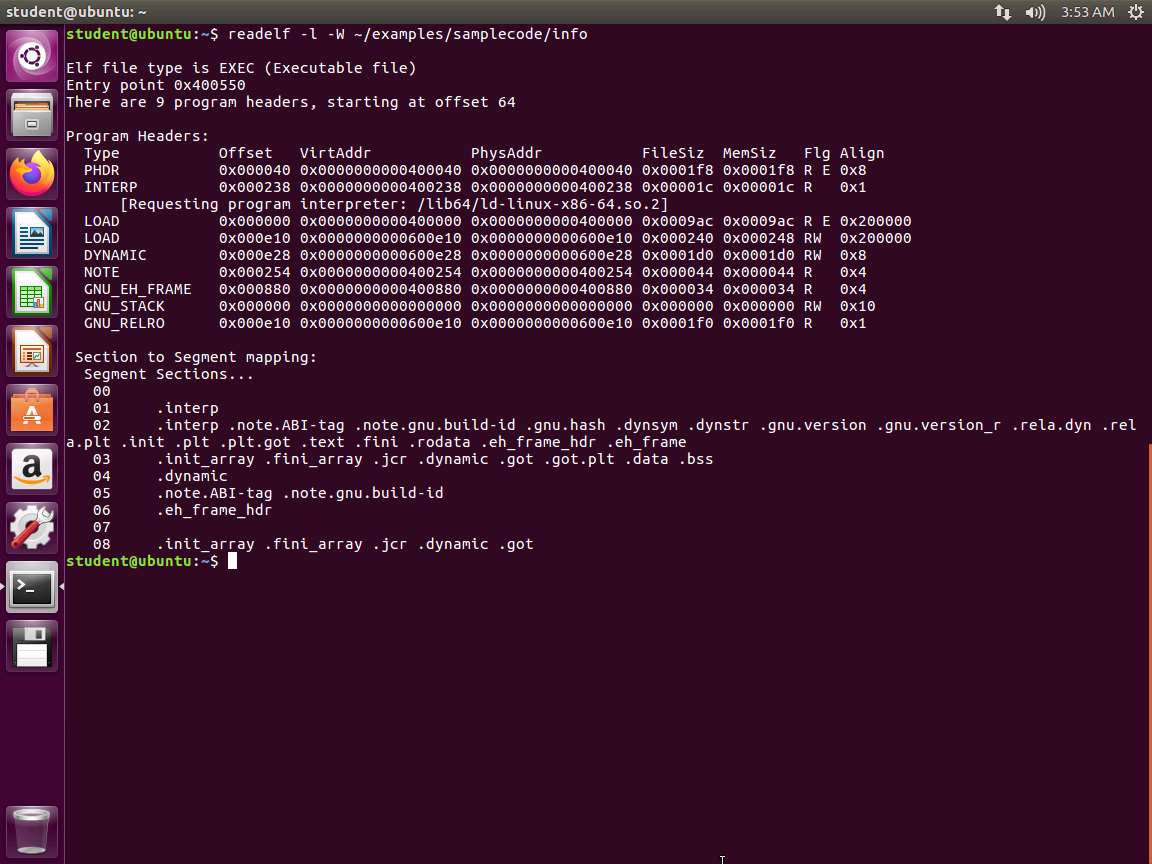
Screenshot This provides us with additional information as well. Next, enter the following commands and review the output of each one.
a. readelf -S -W ~/examples/samplecode/info
b. readelf -p .text ~/examples/samplecode/info
c. readelf -x .text -W ~/examples/samplecode/info
An example of the output of these commands is shown in the following screenshot.
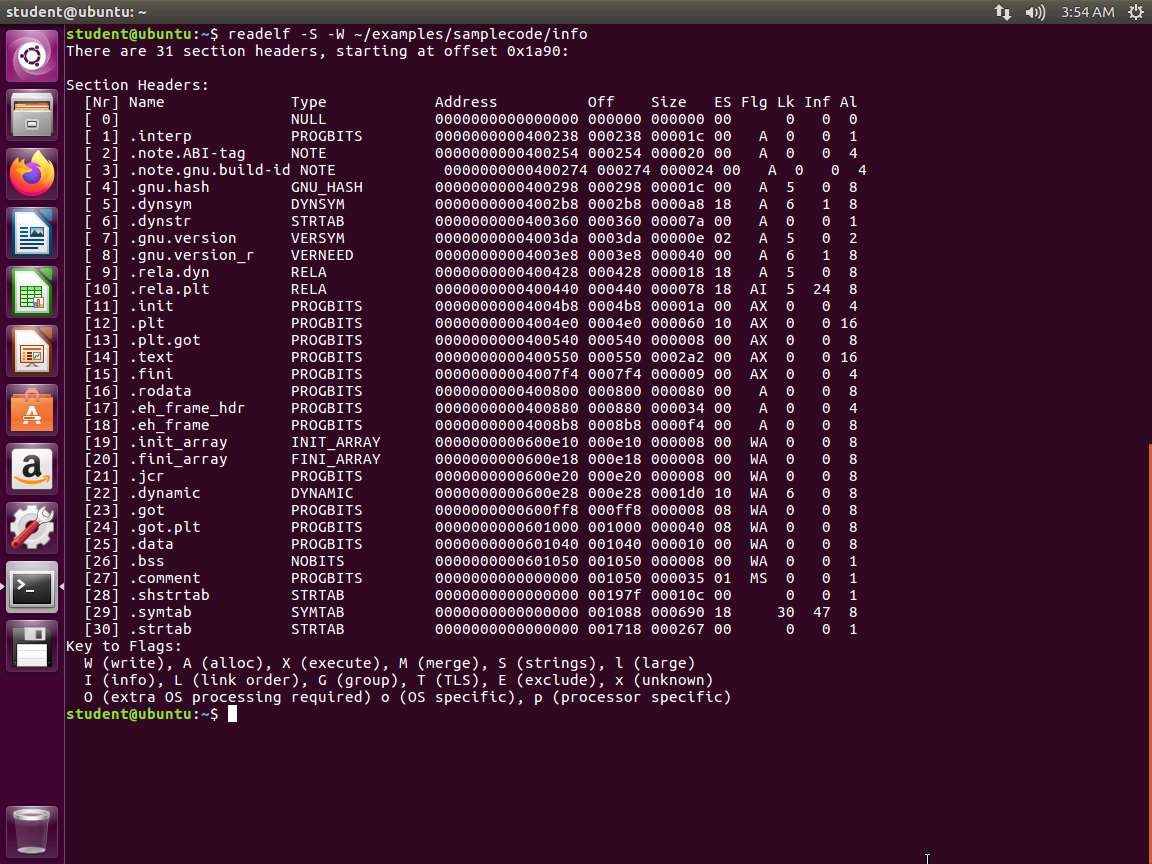
Screenshot 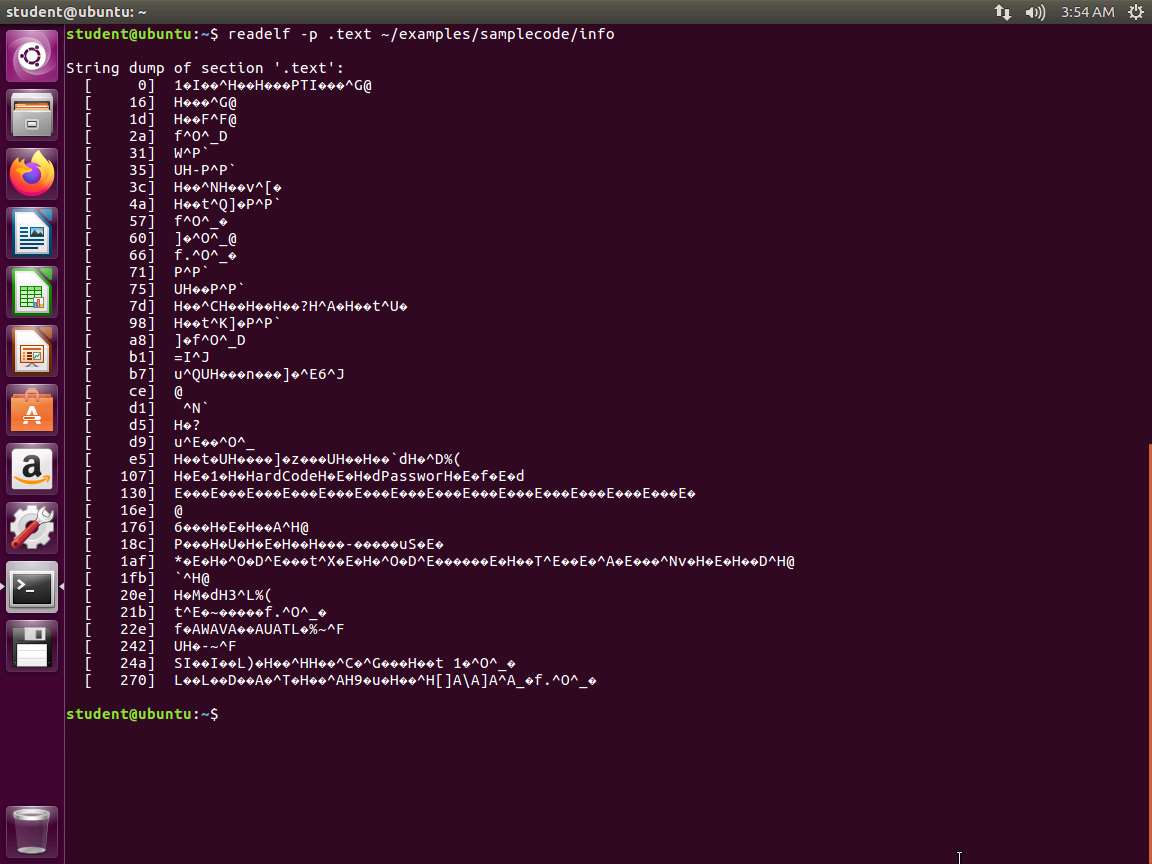
Screenshot 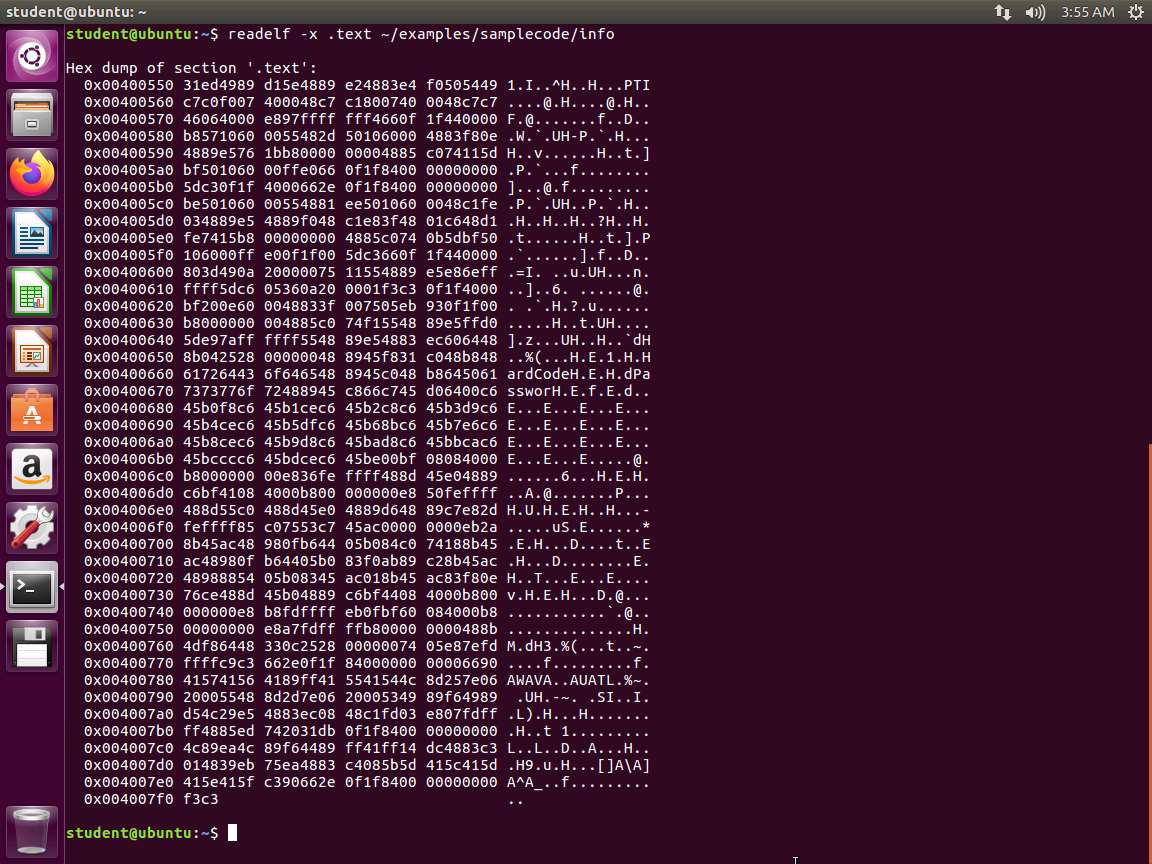
Screenshot As the above screenshot shows, we see the hardcoded password in the dump.
In the terminal, enter the next series of commands and review the output of each one.
a. readelf -R .text -W ~/examples/samplecode/info
b. readelf -p .strtab -W ~/examples/samplecode/info
c. objdump -f ~/examples/samplecode/info
d. objdump -j .text -s ~/examples/samplecode/info
e. objdump -x ~/examples/samplecode/info
f. hexdump -C ~/examples/samplecode/info
An example of the output of these commands is shown in the following screenshot.
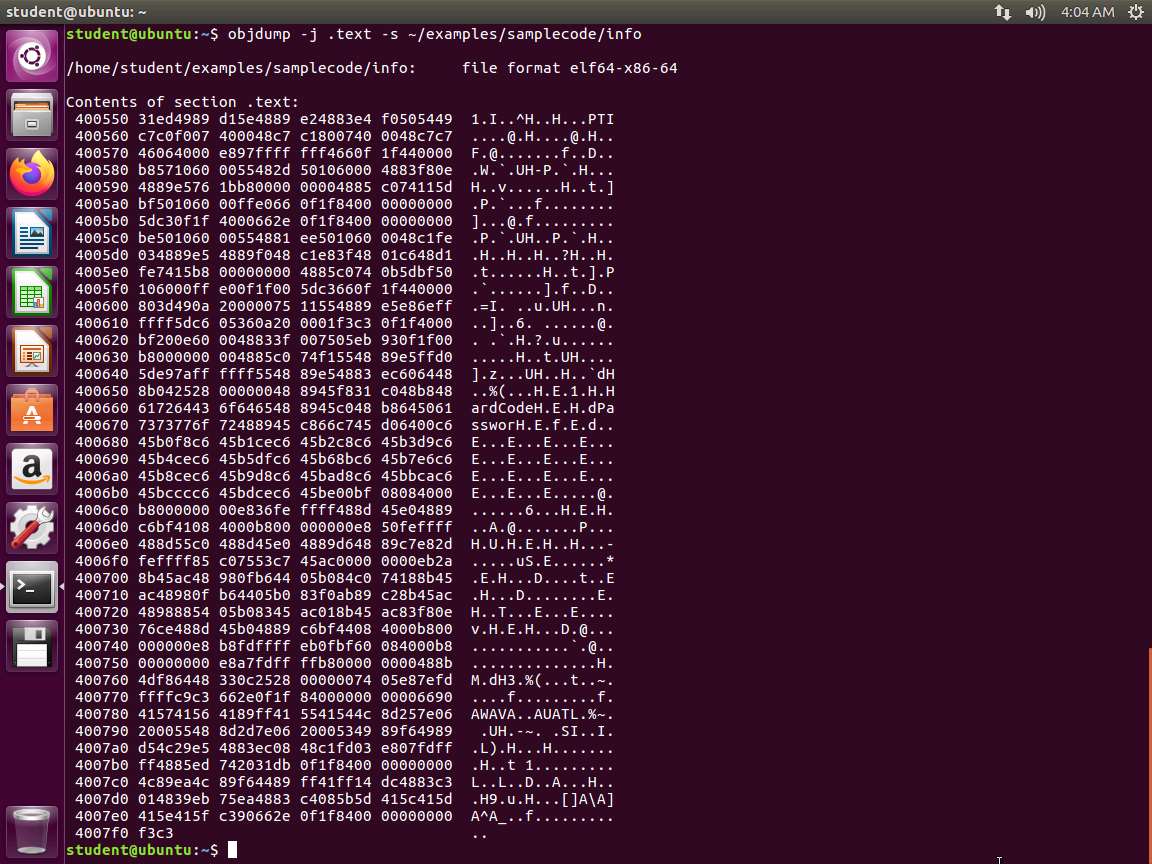
Screenshot You are encouraged to examine which output you prefer and use that tool while also understanding any shortcomings it may have. An alternative tool to hexdump is xxd. A more powerful tool, because it allows us to modify the binary, is hexedit. You can install any of these using the APT package manager on the Ubuntu virtual machines by typing the following in a terminal session: sudo apt install hexedit -y. Note that an Internet connection is mandatory.
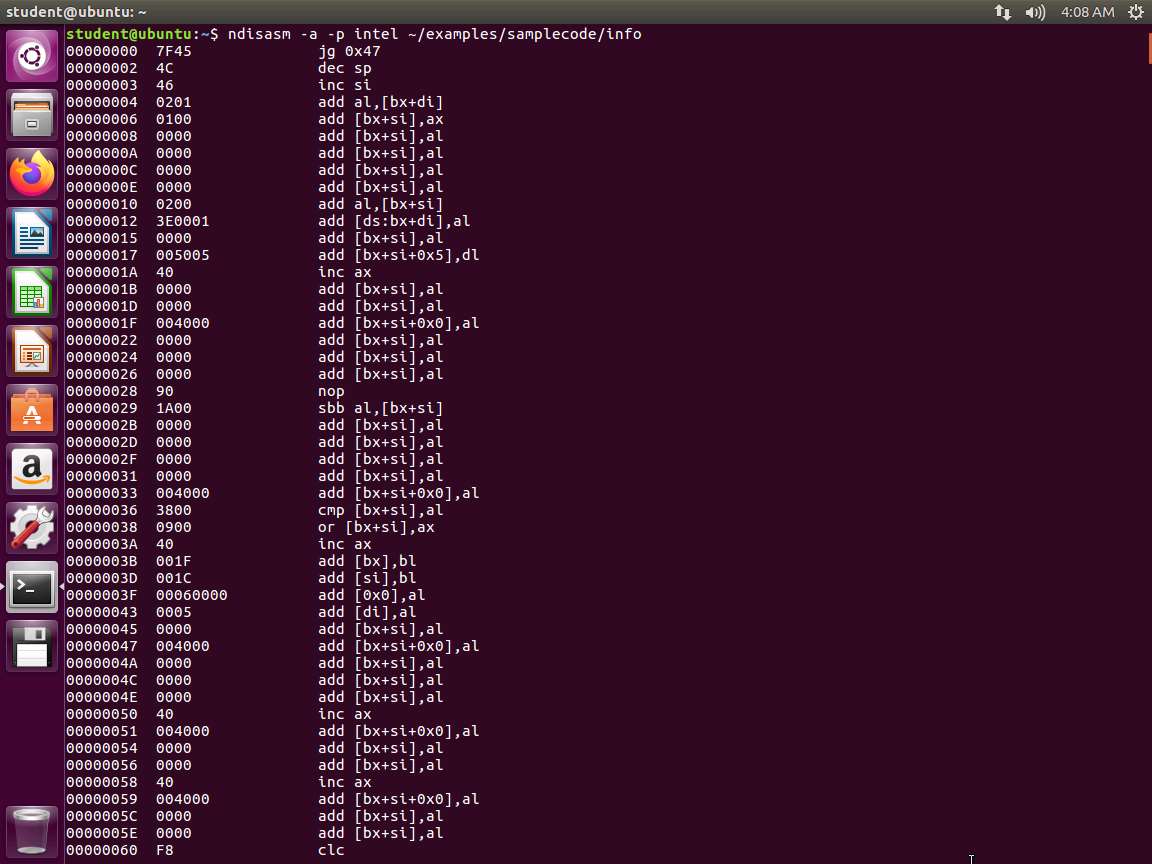
The next tool we will use is the Netwide Disassembler. In the terminal window, enter ndisasm -a -p intel ~/examples/samplecode/info. An example of the command output is shown in the following screenshot.
Screenshot The next command to enter is objdump -D -M intel ~/examples/samplecode/info. An example of the command output is shown in the following screenshot.
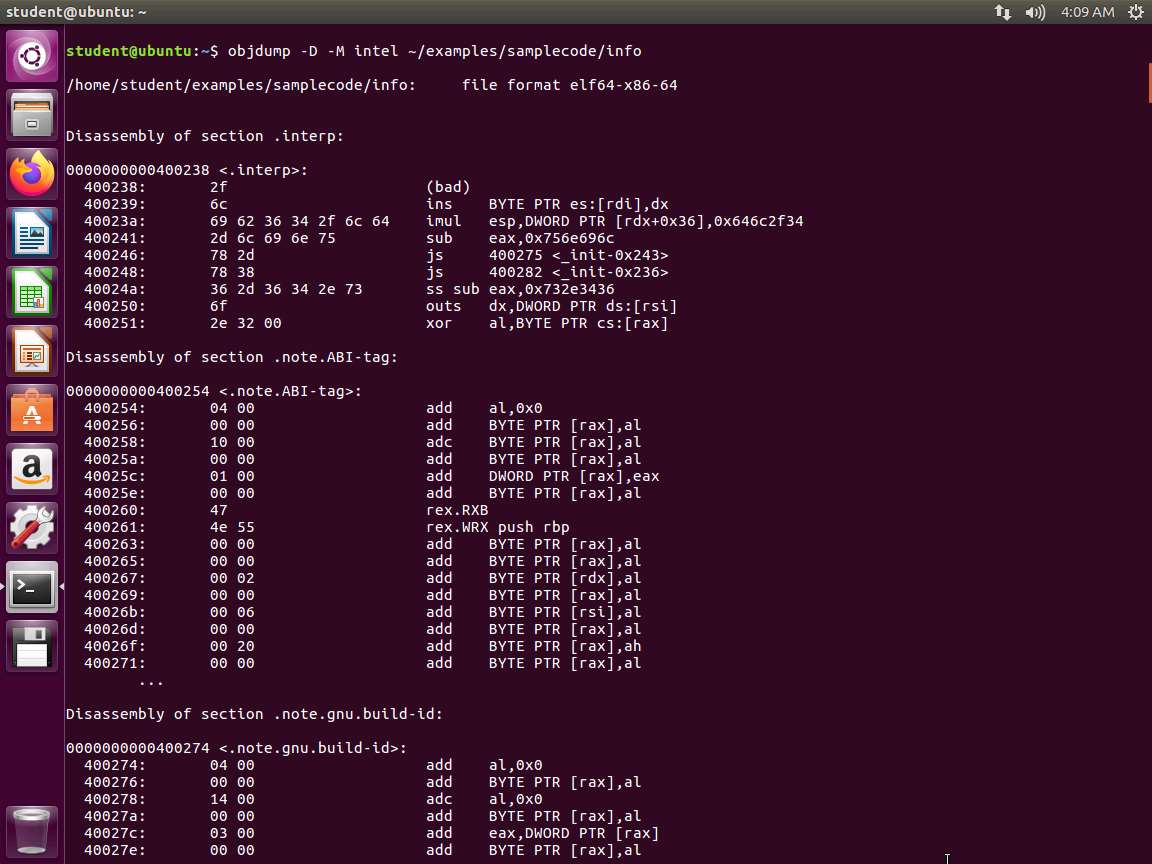
Screenshot As a reminder, the intel option is to format the output in Intel and not the default of AT&T.
Enter the next series of commands and review the output of each:
a. objdump -d -M intel ~/examples/samplecode/info
b. objdump -d -M intel ~/examples/samplecode/info.o
An example of the dump of the object code file is shown in the following screenshot.
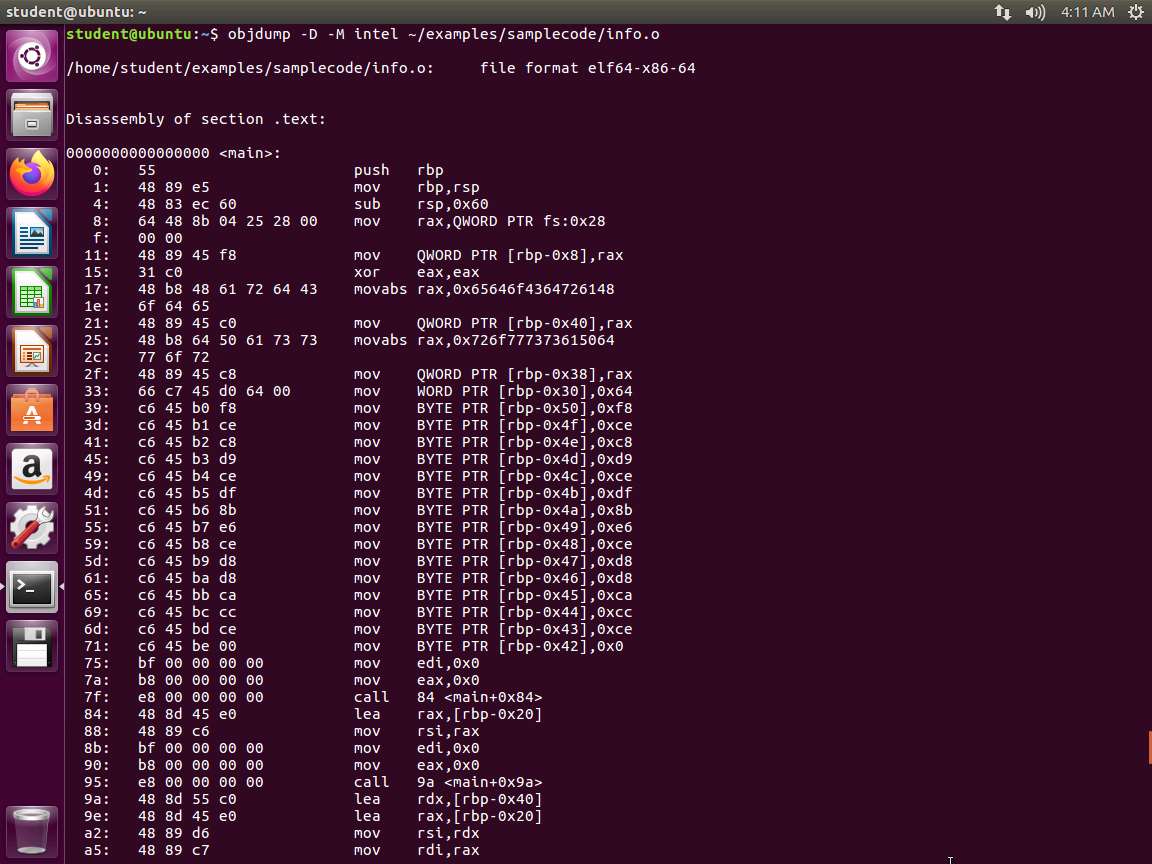
Screenshot Note the difference in output between disassembling the assembled object file only. This file has not been linked yet and has only undergone the preprocessor and assembly processes.
At this stage, we want to look at dynamic analysis. Before we do that, we can work through the debugger to get more practice. Enter the following commands and examine the output from each one.
a. gdb ~/examples/samplecode/info
b. set disassembly-flavor intel
c. break main
d. run
An example of when the program hits the breakpoint is shown in the following screenshot.
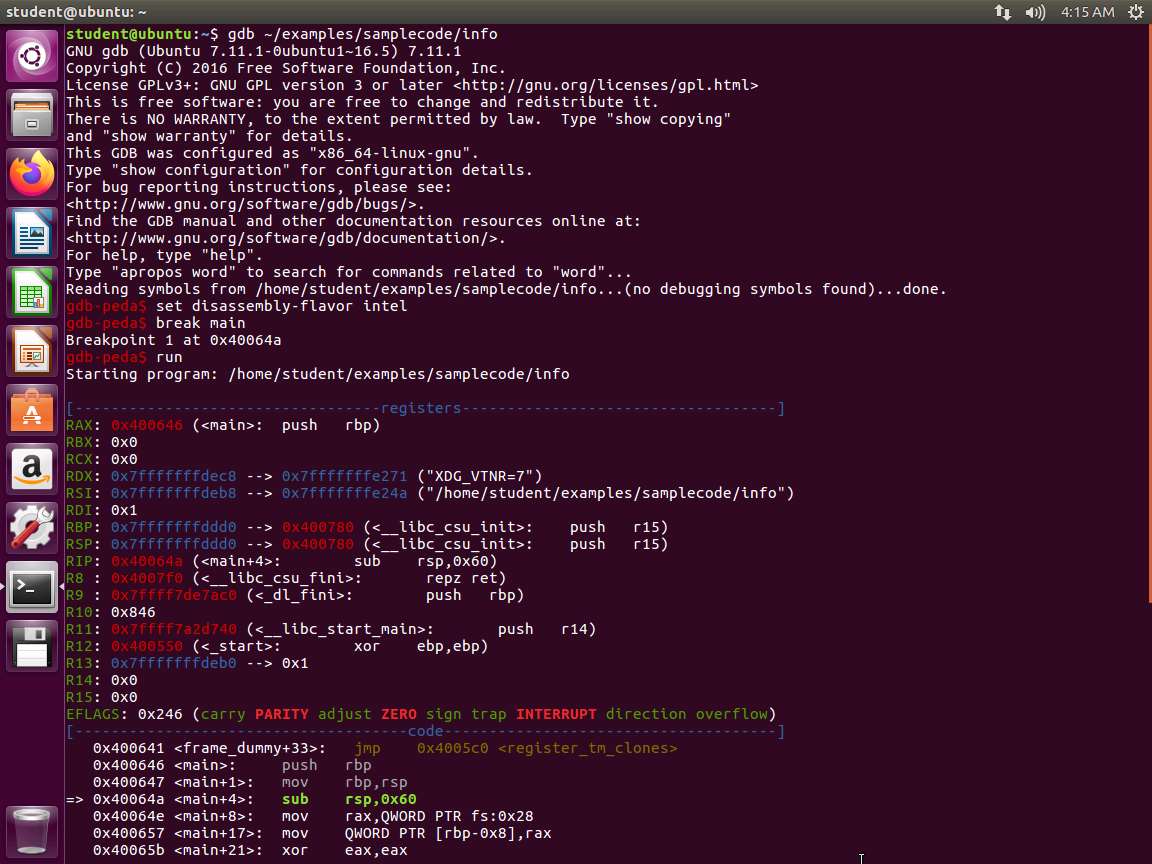
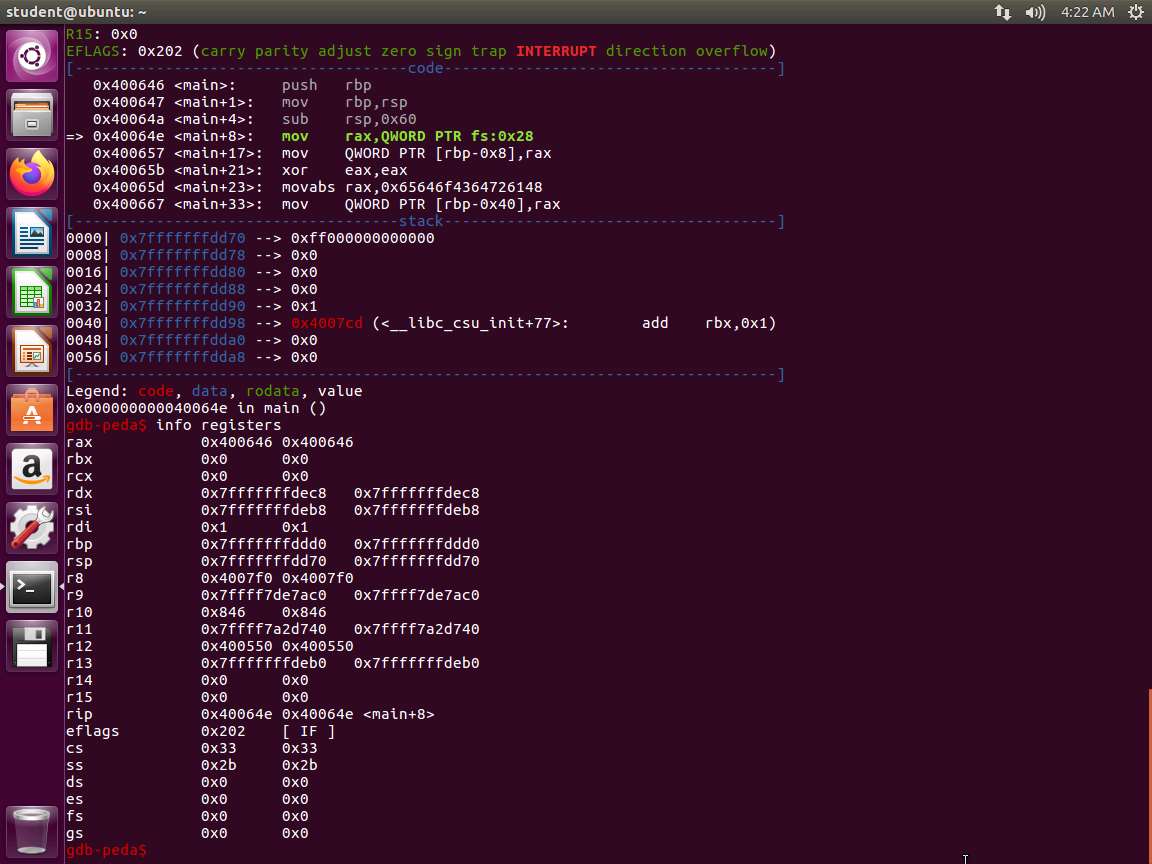
Screenshot Now, we are ready to view the contents of the registers. Enter info registers.
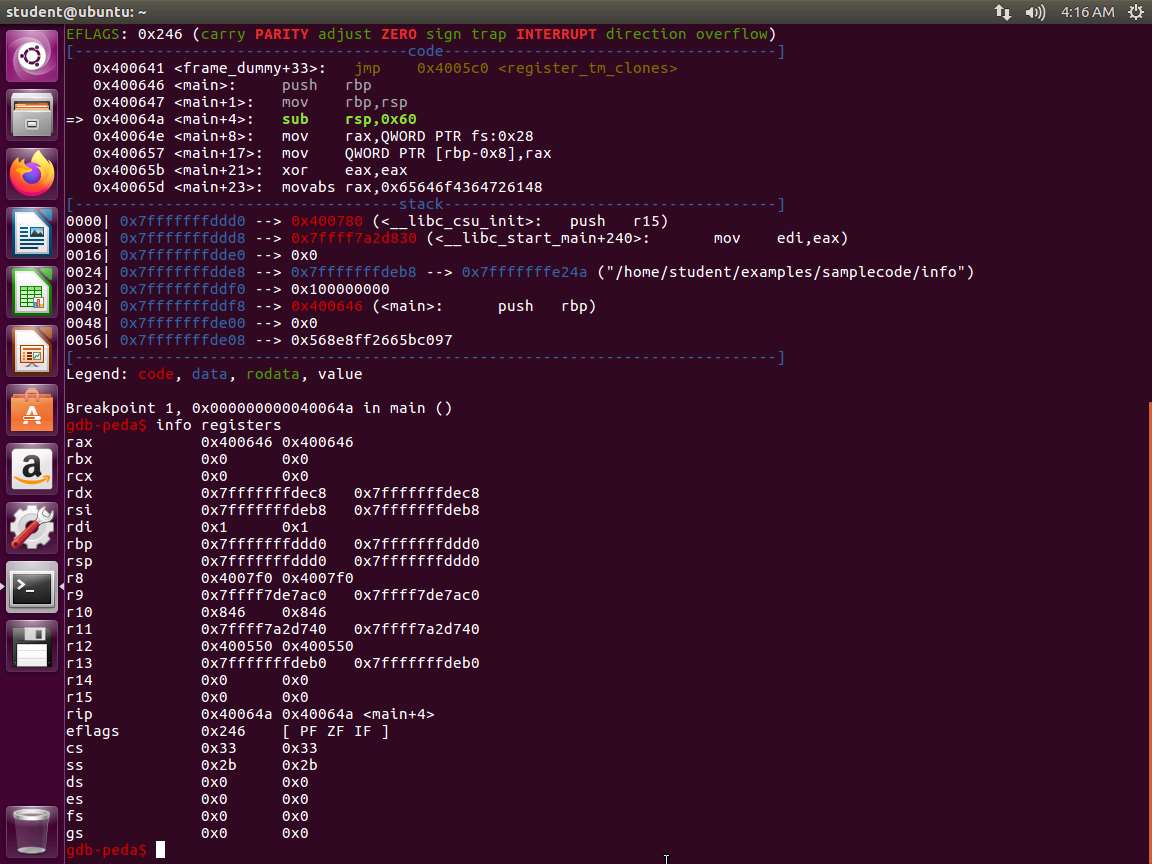
Screenshot Next, enter the following series of commands:
a. nexti
b. info registers
c. nexti
d. info registers
An example of the output is shown in the following screenshot.
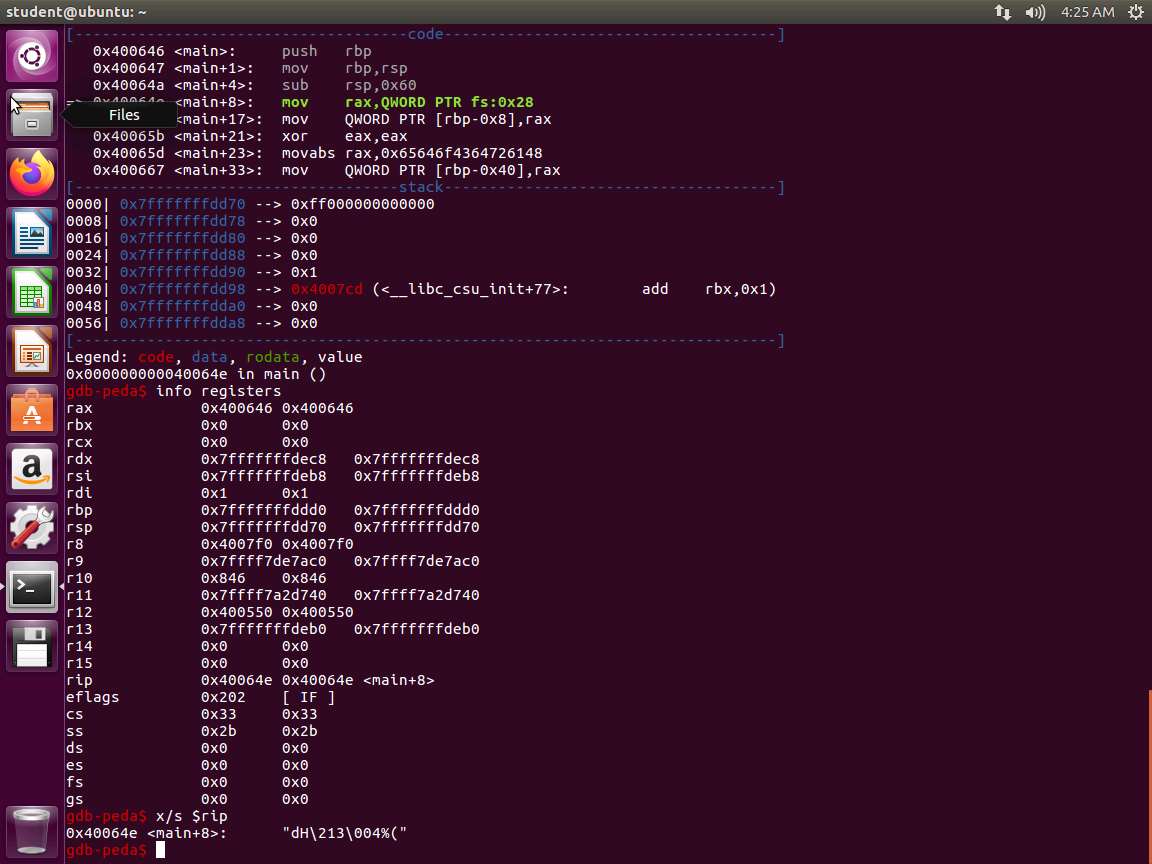
Screenshot Enter the x/s $rip command, if you are using the 64-bit system. Essentially, this final command tells GDB we want to examine the RIP register and display the output as a string.
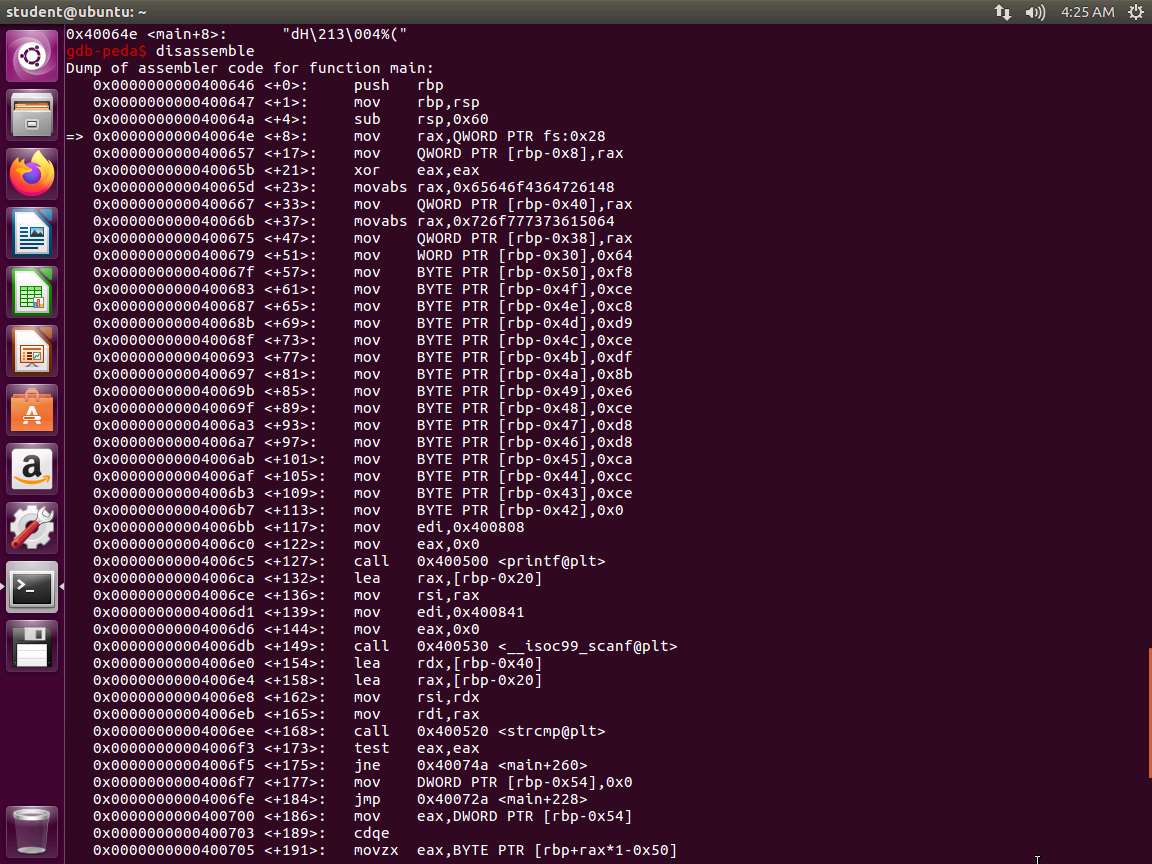
Screenshot Next, enter disassemble. Take a few minutes to review the output of this command.
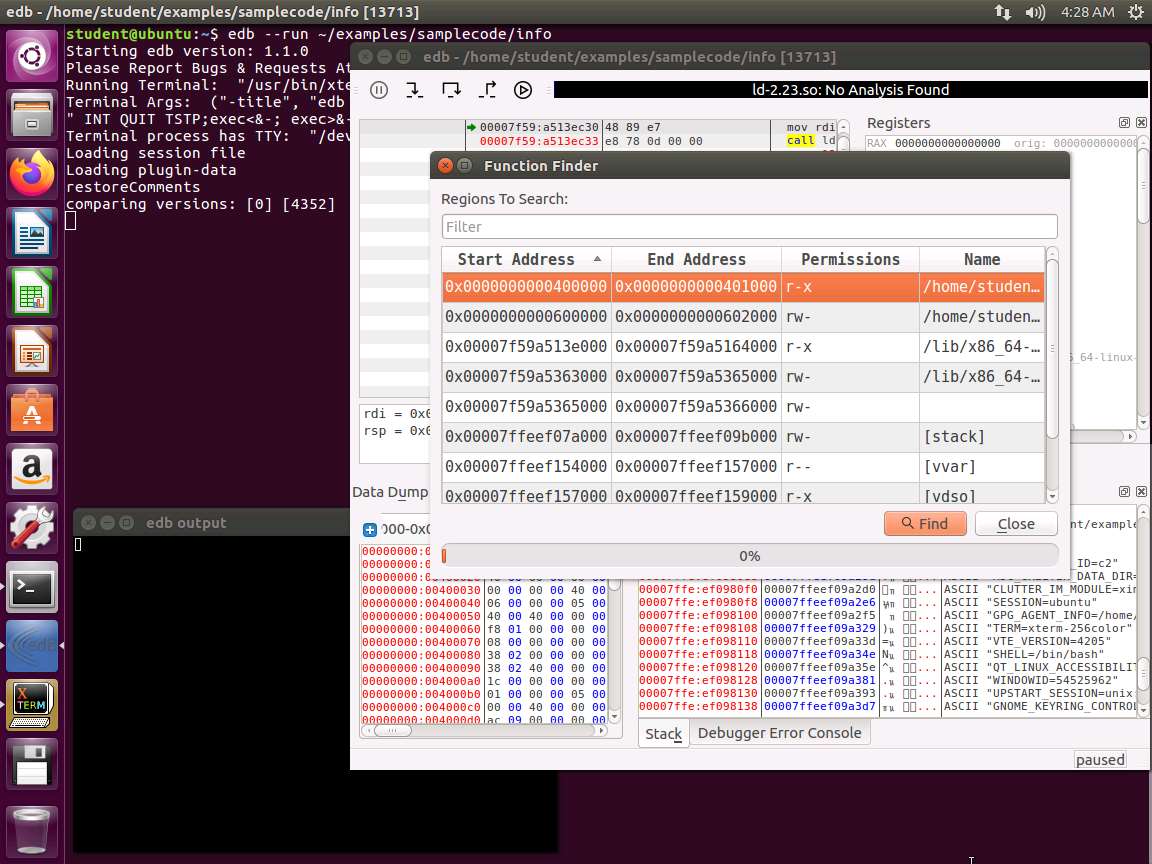
Screenshot We are now ready to move to the next step. Enter quit. This will exit the debugger. We will try another. Enter edb --run ~/examples/samplecode/info. This will launch Evans Debugger as shown in the following screenshot.
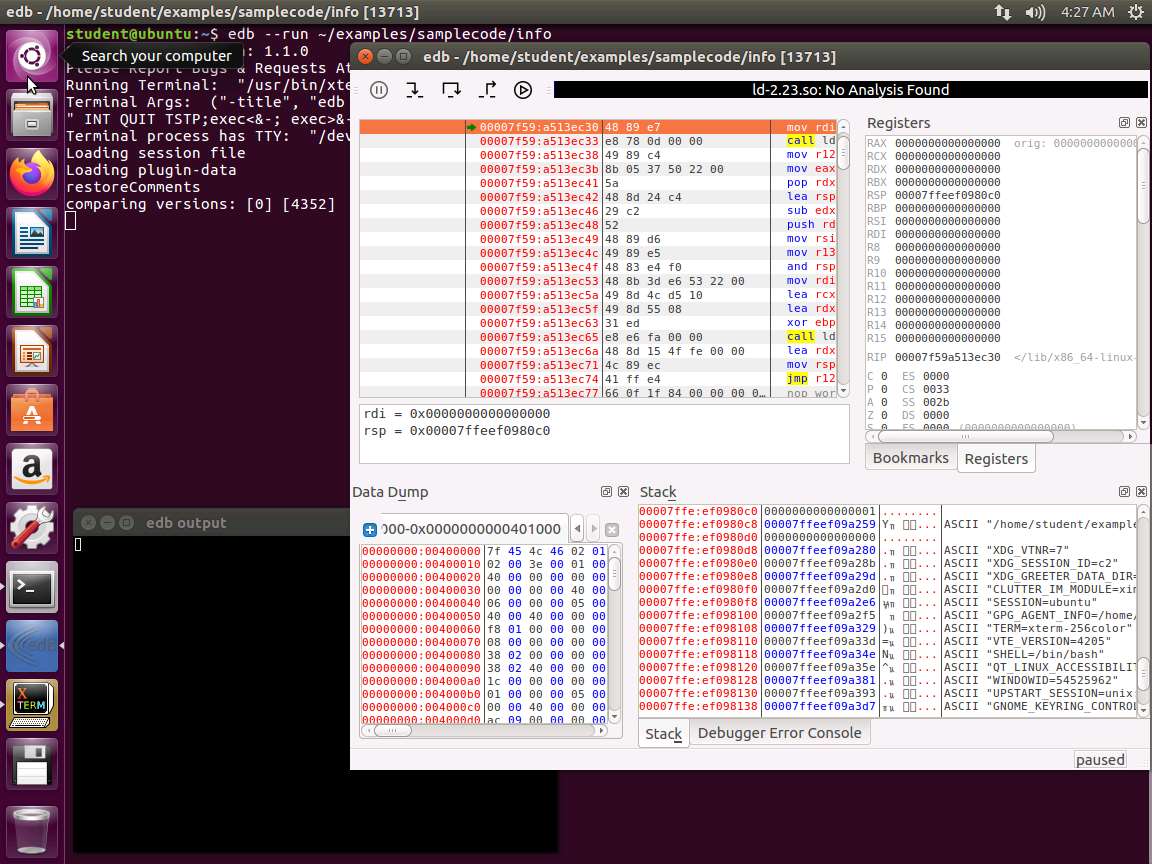
Screenshot Next, click on CTL+SHIFT+f to open the function finder. The window will open with the first instruction highlighted as shown in the following screenshot.
Screenshot Next, click on the Find button, and look for the info main function in the symbol table. Click on it, and then select Graph Selected Function. Take a few minutes to review the results from the graphing of the function.
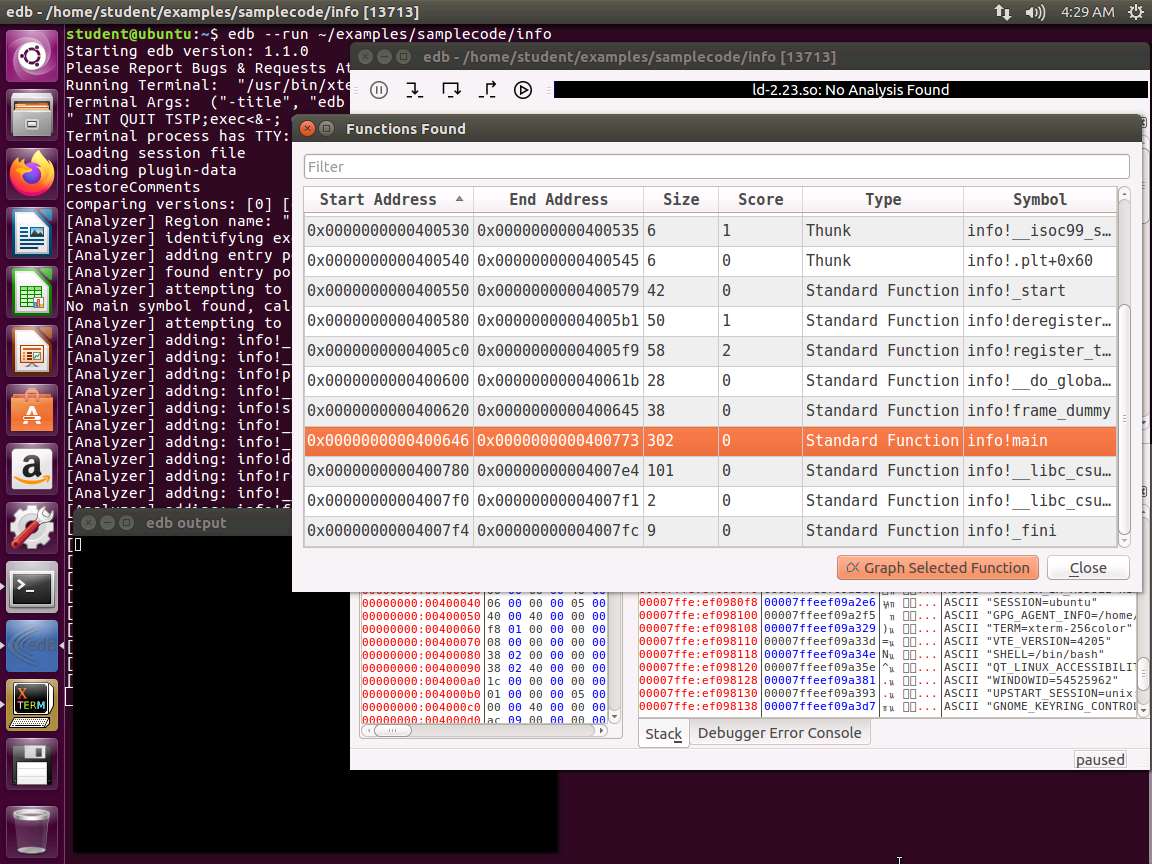
Screenshot 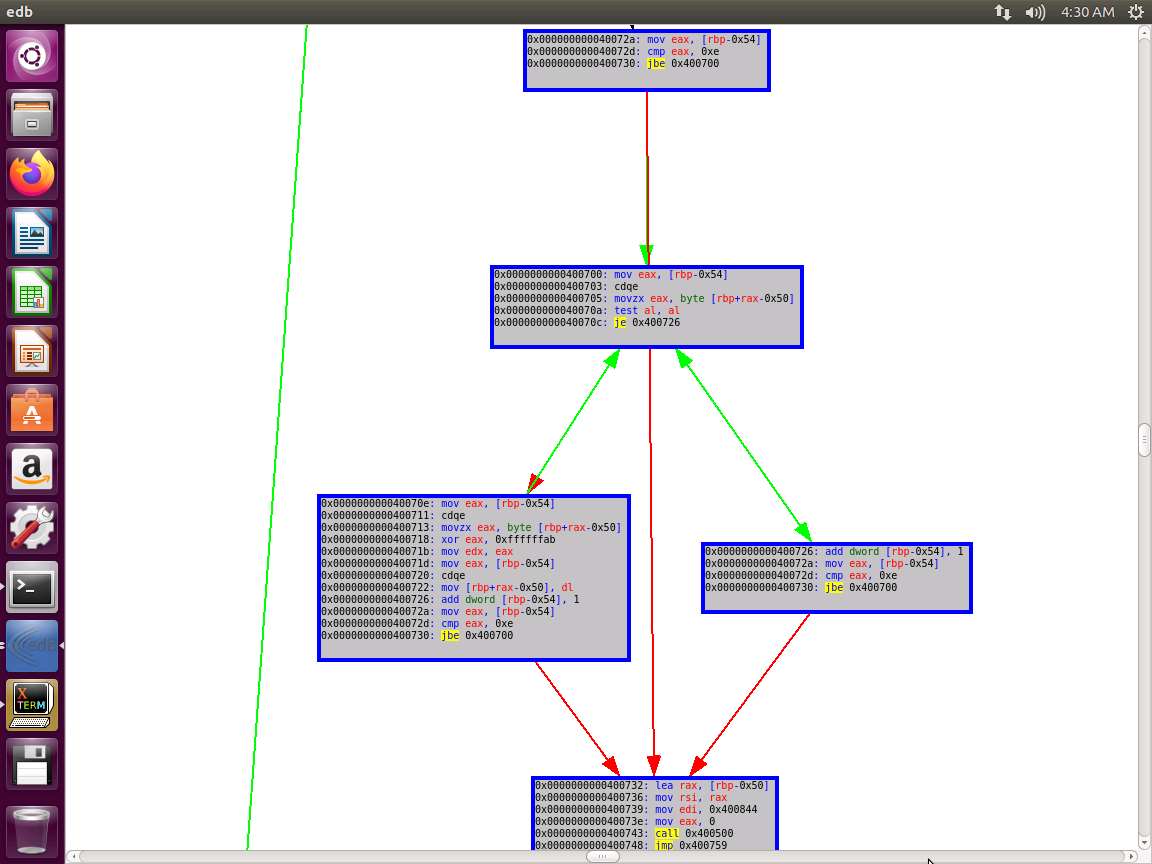
Screenshot As you see, there is a lot of capability and power with the tool edb. Close edb and enter strace ~/examples/samplecode/info. An example of the command output is shown in the following screenshot.
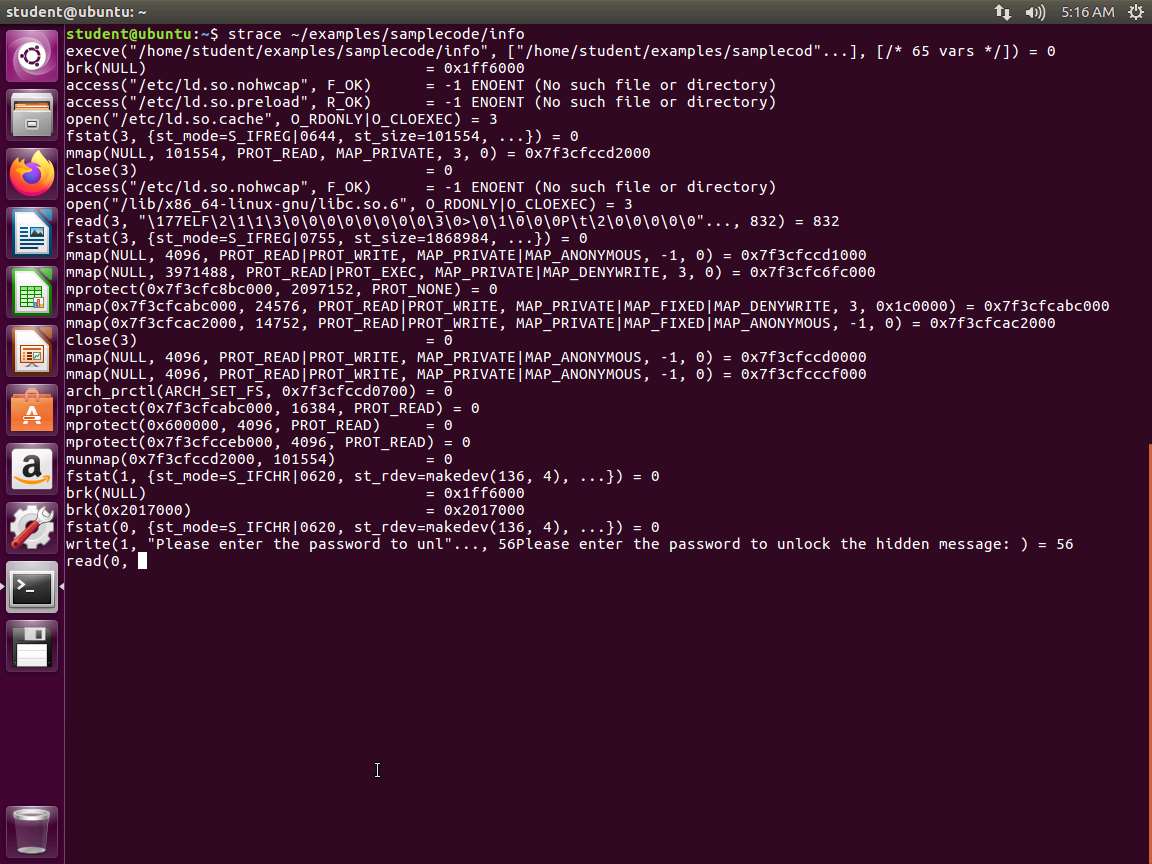
Screenshot Take a few minutes and observe the results. Enter a variety of strings and observe the results again.
Next, enter ltrace ~/examples/samplecode/info. Again, enter different strings and observe the output. You will see the string compare function. This is because ltrace shows the libraries that are in the executable. An example of this is shown in the following screenshot.
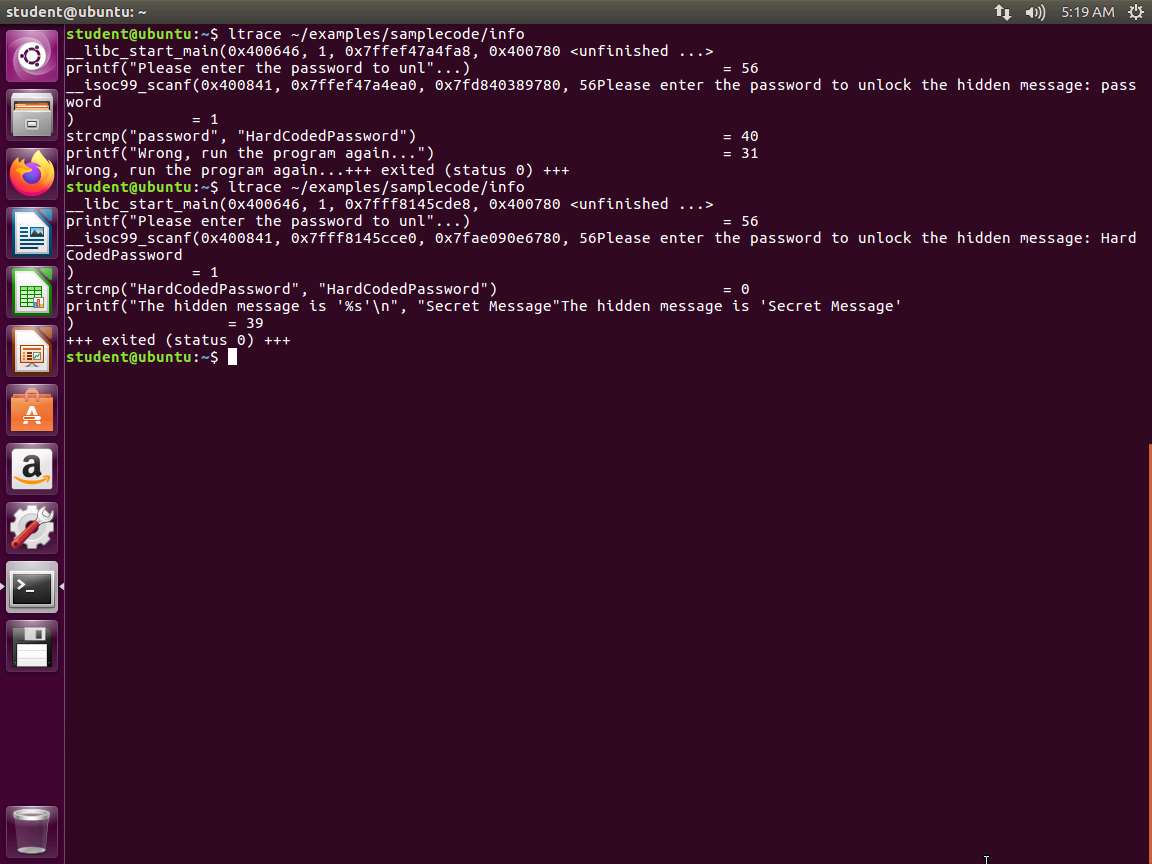
Screenshot It is a good idea to use automation. An example of an automation script is in the samplecode folder, and it is called automation.sh.
We will analyze one more binary before we complete the lab. Enter the following commands and analyze the output:
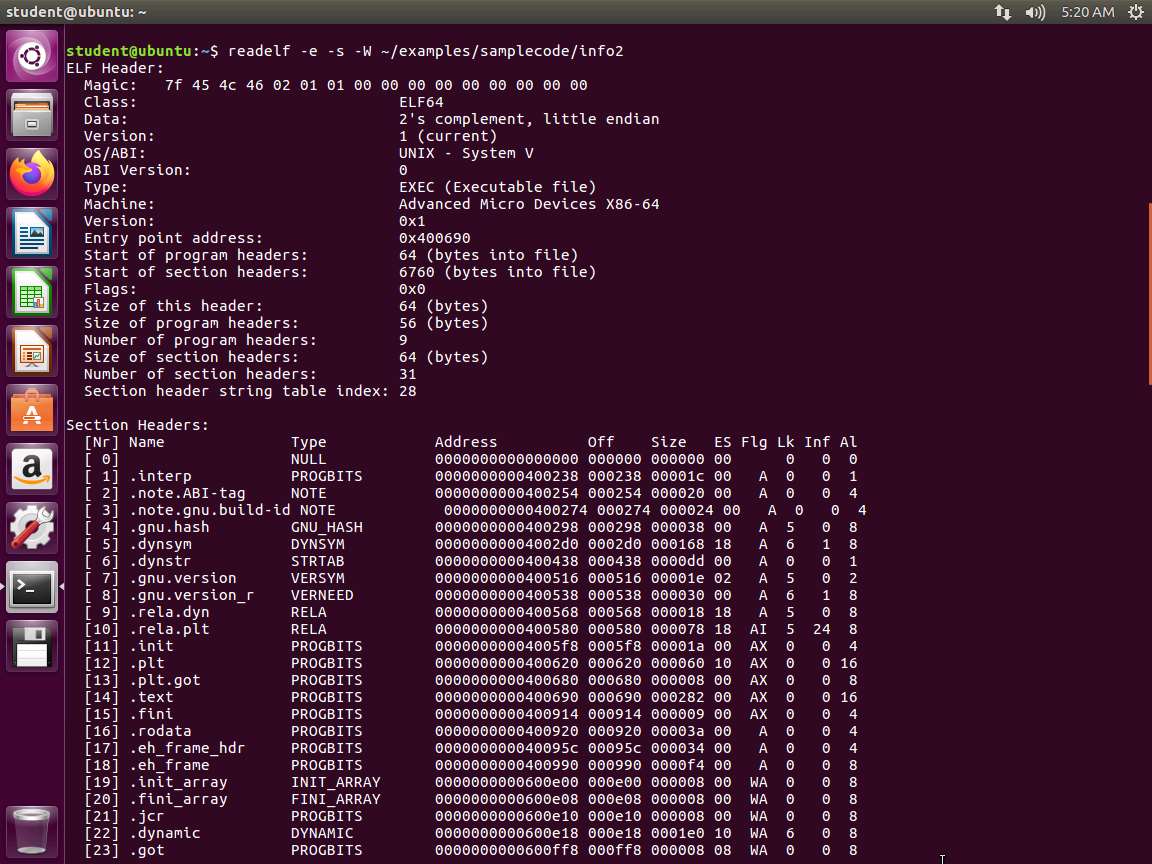
a. readelf -e -s -W ~/examples/samplecode/info2
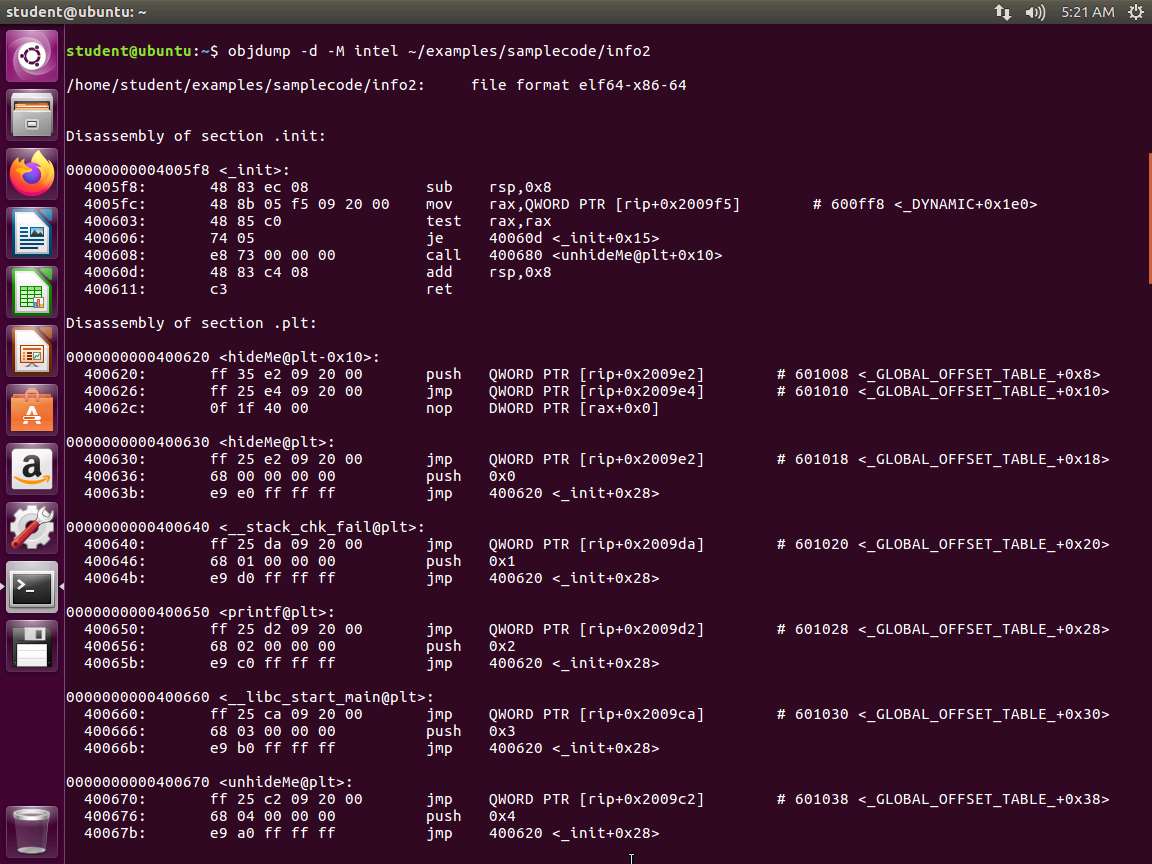
Screenshot b. objdump -d -M intel ~/examples/samplecode/info2
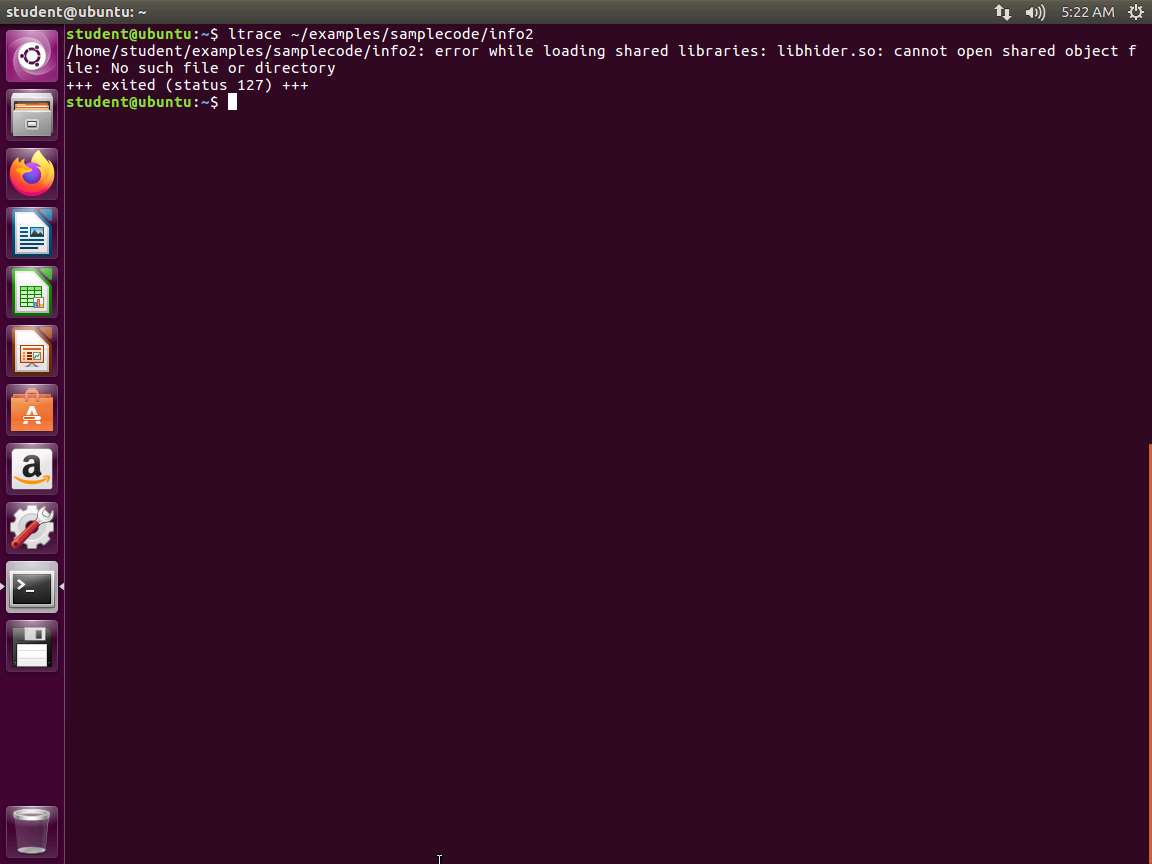
Screenshot c. ltrace ~/examples/samplecode/info2
Screenshot d. strace ~/examples/samplecode/info2
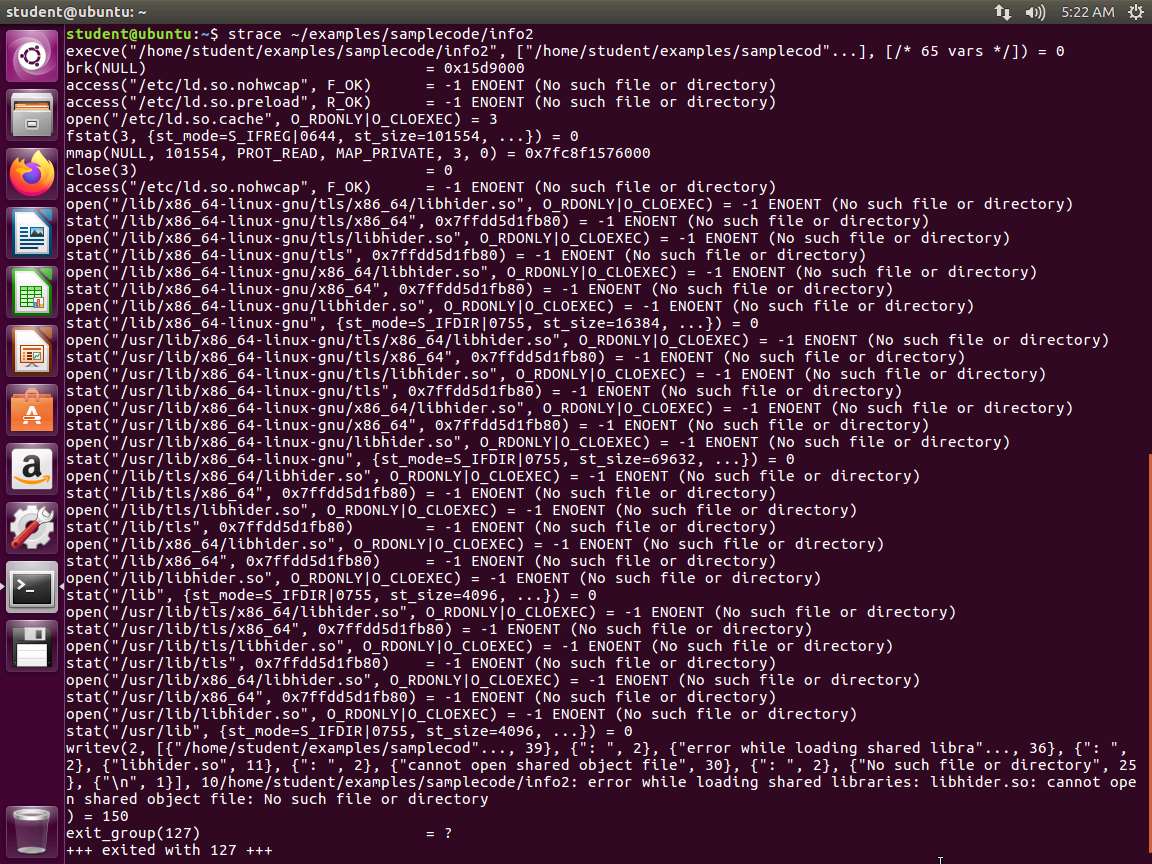
Screenshot The lab objectives have been achieved. Close all windows and clean up as required.
Last updated